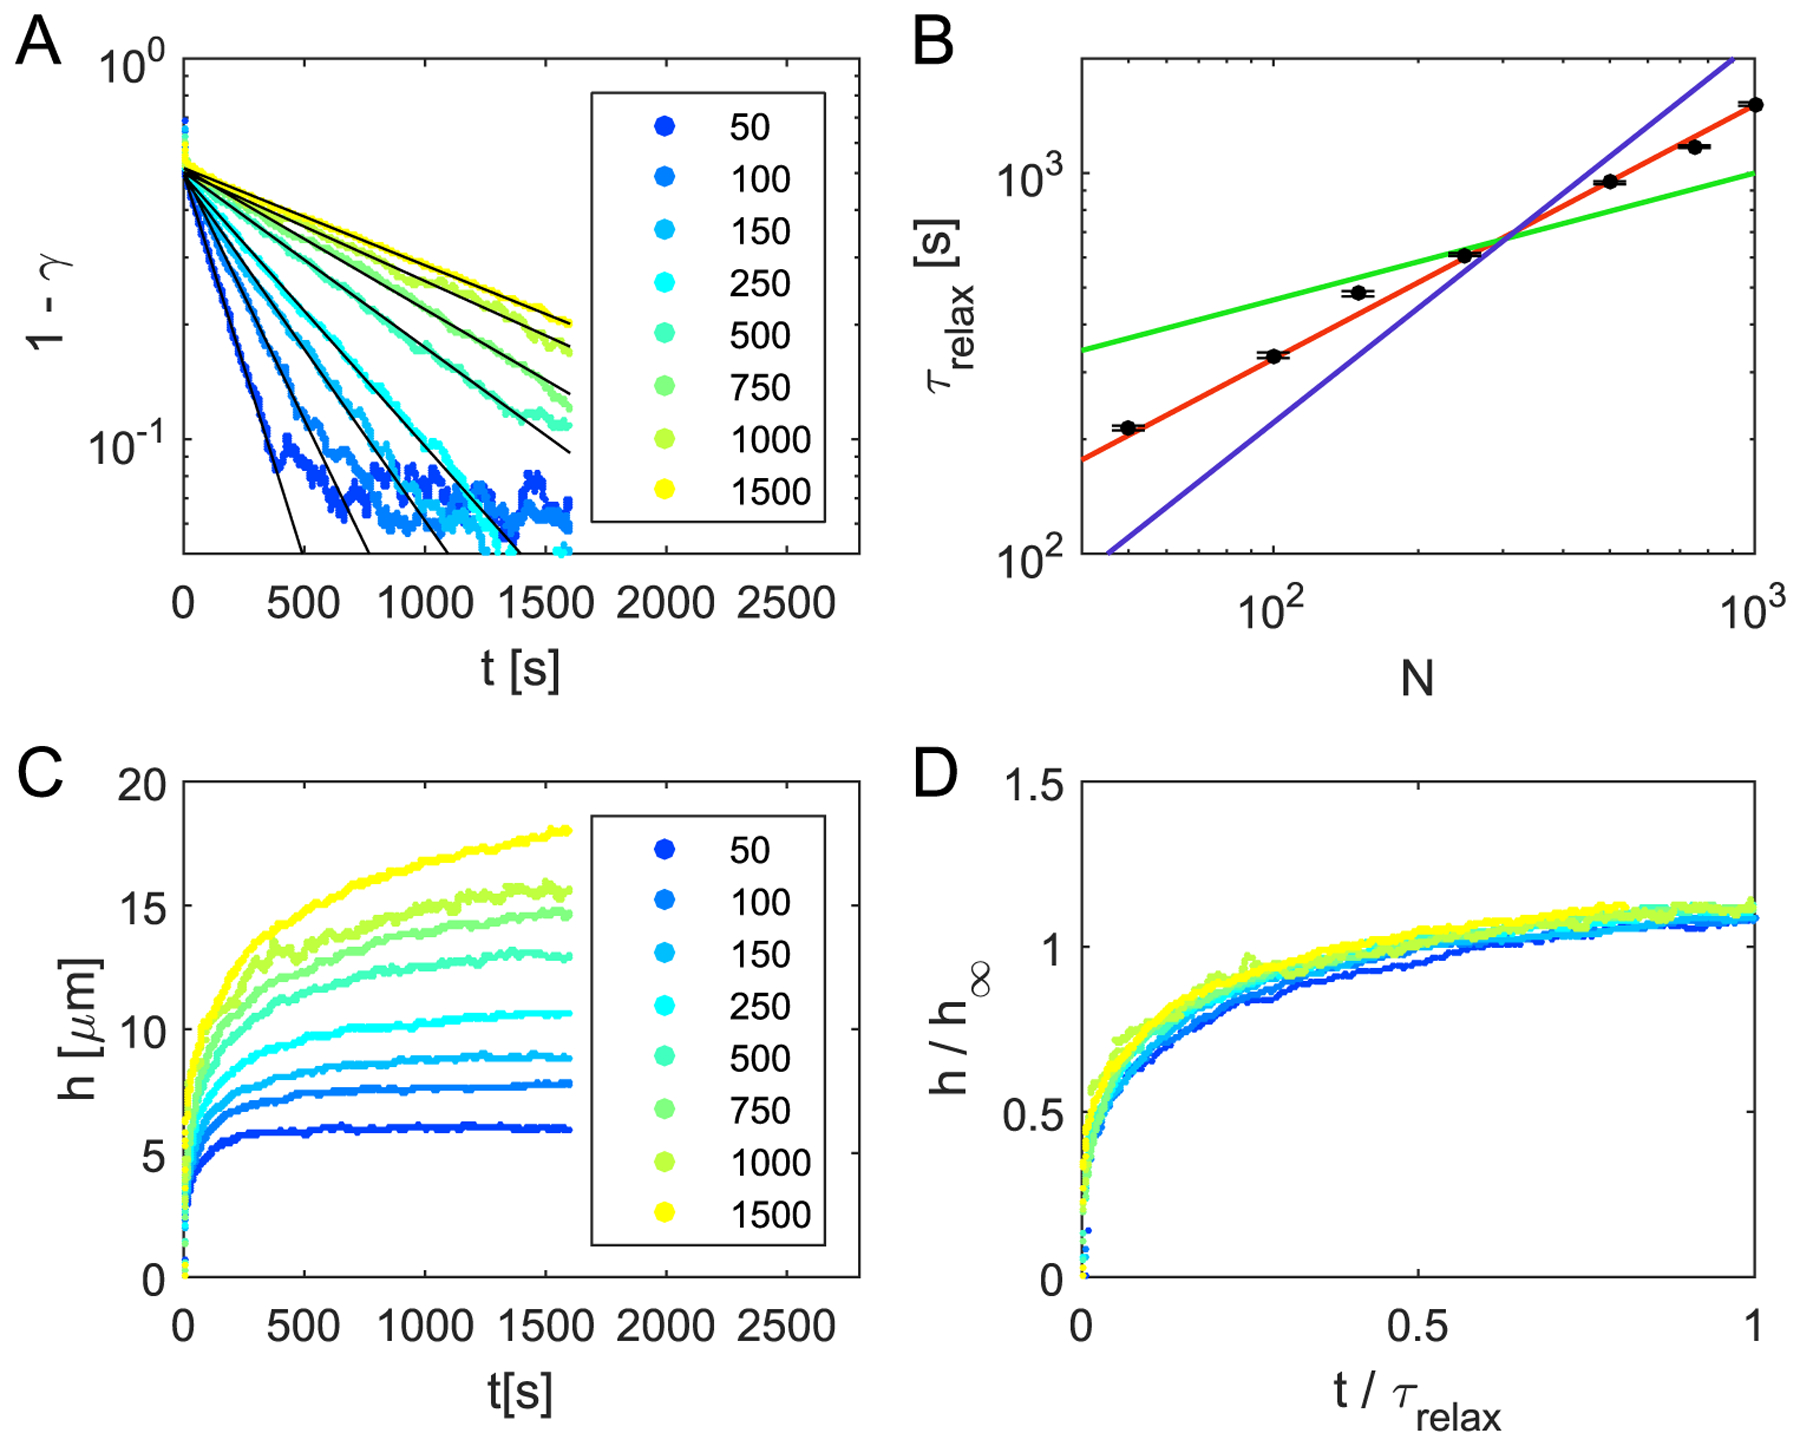
Figure 7.

Scaling of the merging dynamics. (A) Ratio γ of the short and long axis of the ellipse as a function of time for the coalescence of differently sized colonies. The legend shows the numbers of cells in the individual colonies. By fitting an exponential function (black lines) one can extract the relaxation time τrelax as a function of the cell number N. (B) The black dots show the relaxation times resulting from the exponential fit of the axis ratio as a function of the cell number. While τrelax increases with time, we tested different scalings: τrelax ∝ N1/3(green), τrelax ∝ N2/3 (red) and τrelax ∝ N1 (blue). The extracted values for τrelax seem to agree best with τrelax ∝ N2/3. This suggest that the relaxation time is proportional to the surface area of the colonies. (C) Bridge heights h as a function of time for different number of cells inside the colony. The legend shows the numbers of cells in the individual colonies. (D) Rescaled bridge height: the height of the bridge is rescaled by h∞ = 1.4 · N1/3 μm and time by the relaxation time τrelax = 15.1 · N2/3 s. The relaxation time is obtained from 1 – γ (t) (see (A) and (B)). The rescaling for the height h∞ corresponds to the diameter of a spherical colony which is reached at times much larger than the relaxation time τrelax (see figure S4 in the supplementary information). After rescaling all curves collapse.
