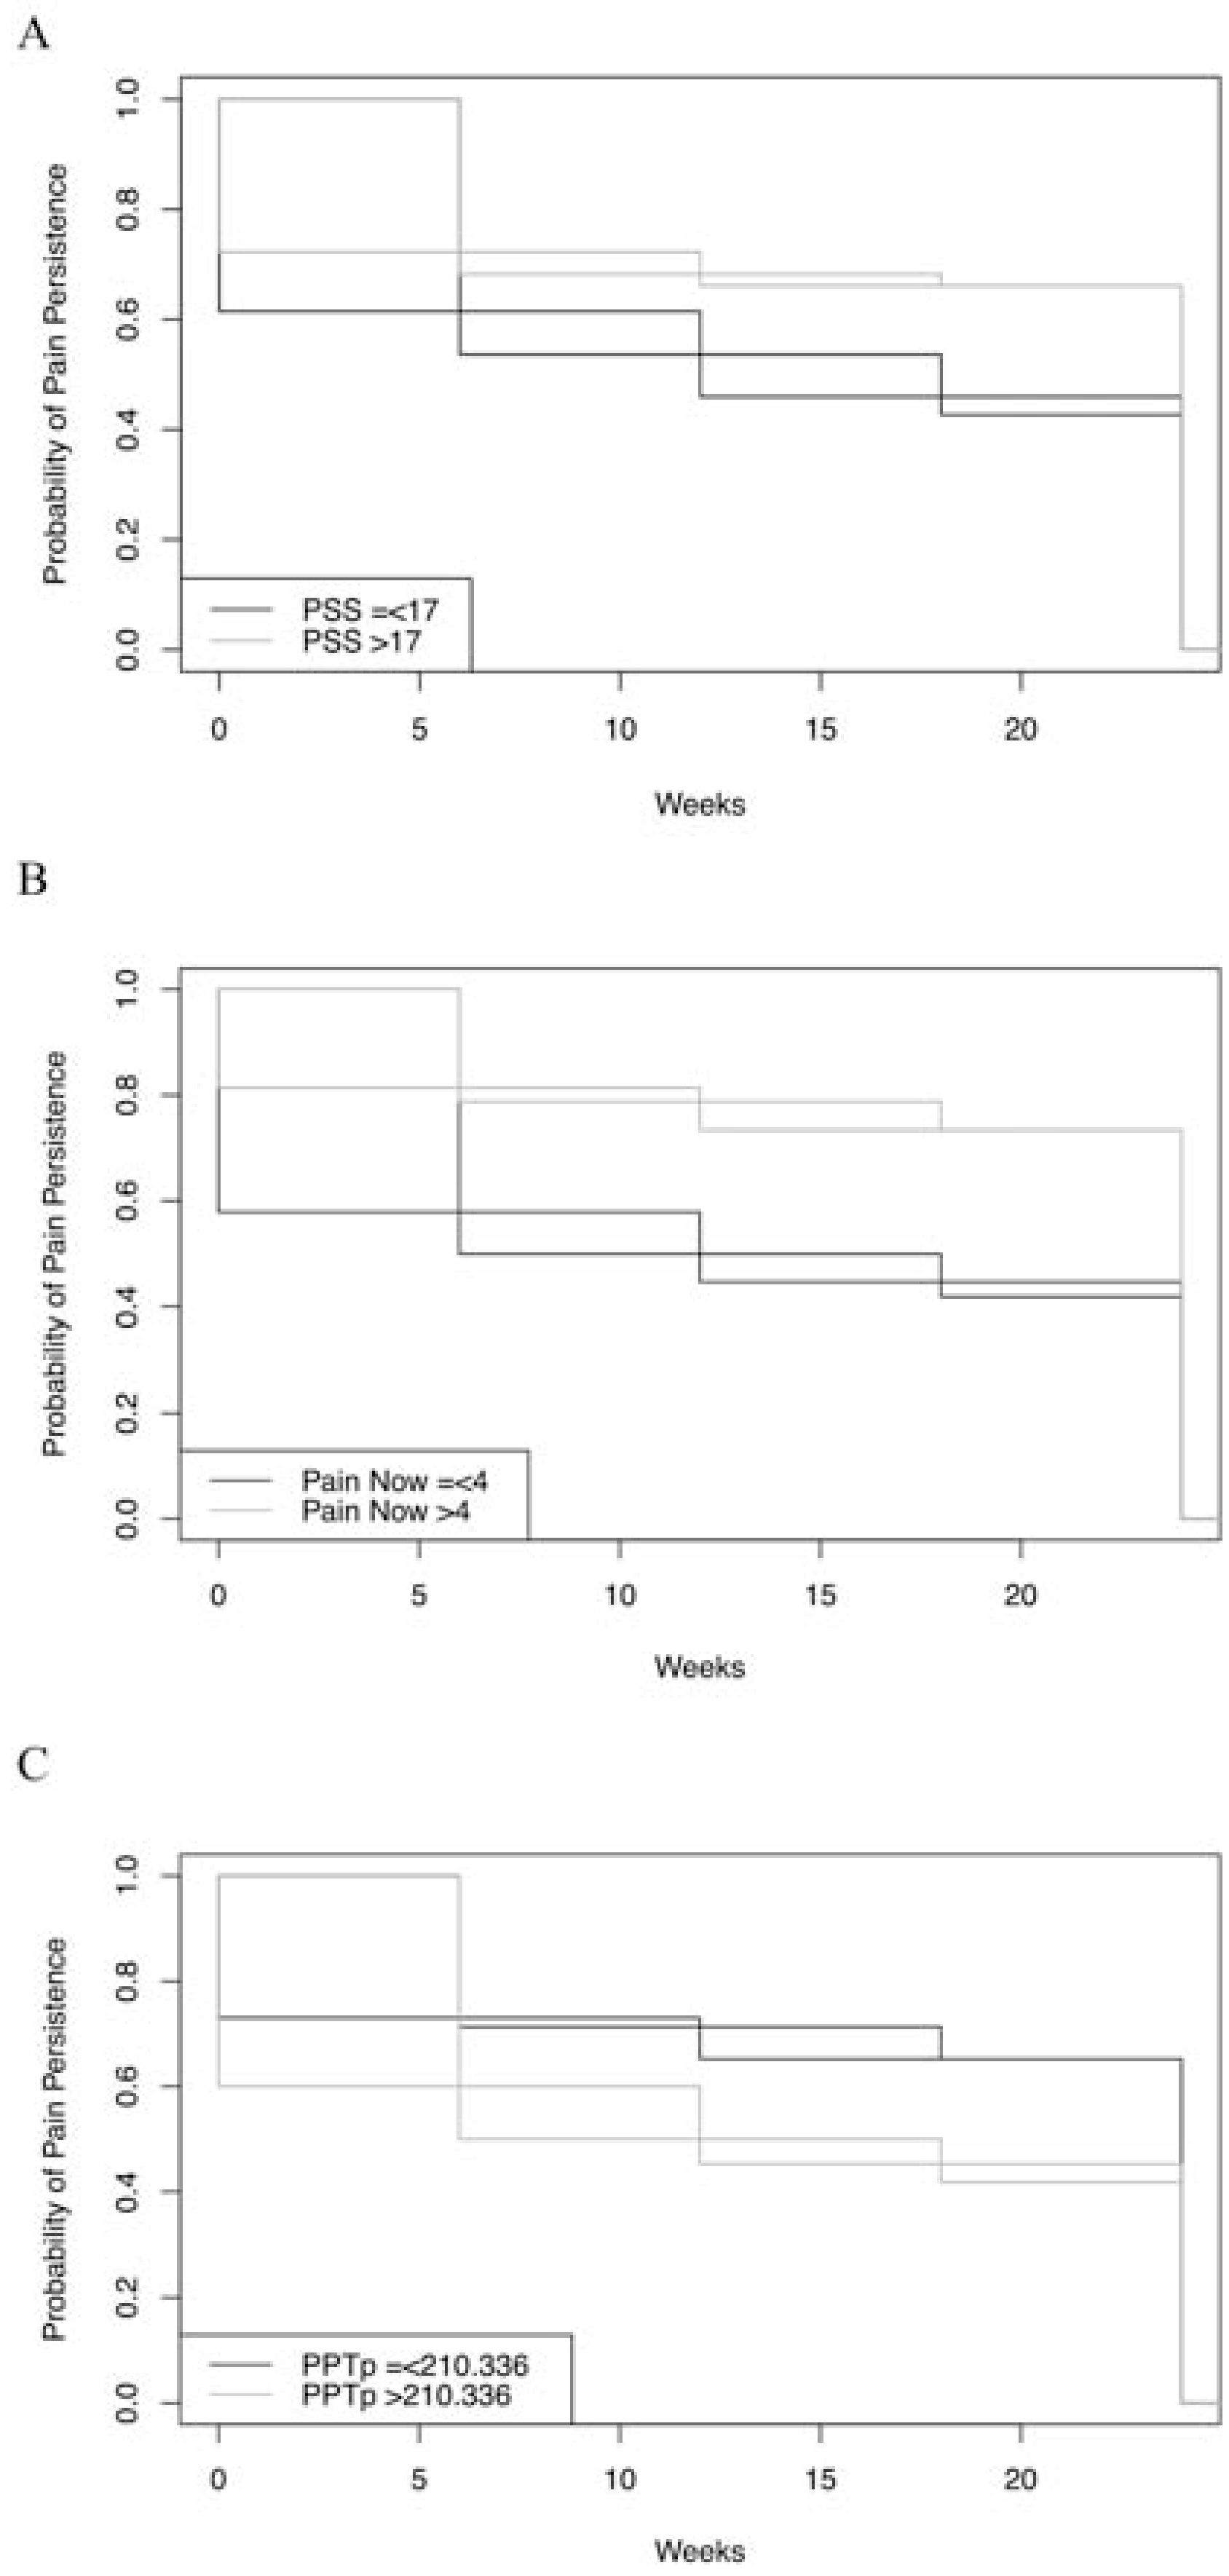
Figure 1 –

Example Plots of Survival Analysis for Three Individual Risk Factors. Note. Panel A: Non-parametric maximum likelihood estimator (NPMLE) plot for Perceived Stress Scale (PSS) scores, p = 0.02. Panel B: NPMLE plot for Brief Pain Inventory (BPI) score at time of baseline study visit, p < 0.001. Panel C: NPMLE plot for pressure pain threshold (PPT) at painful back site, p = 0.01.
