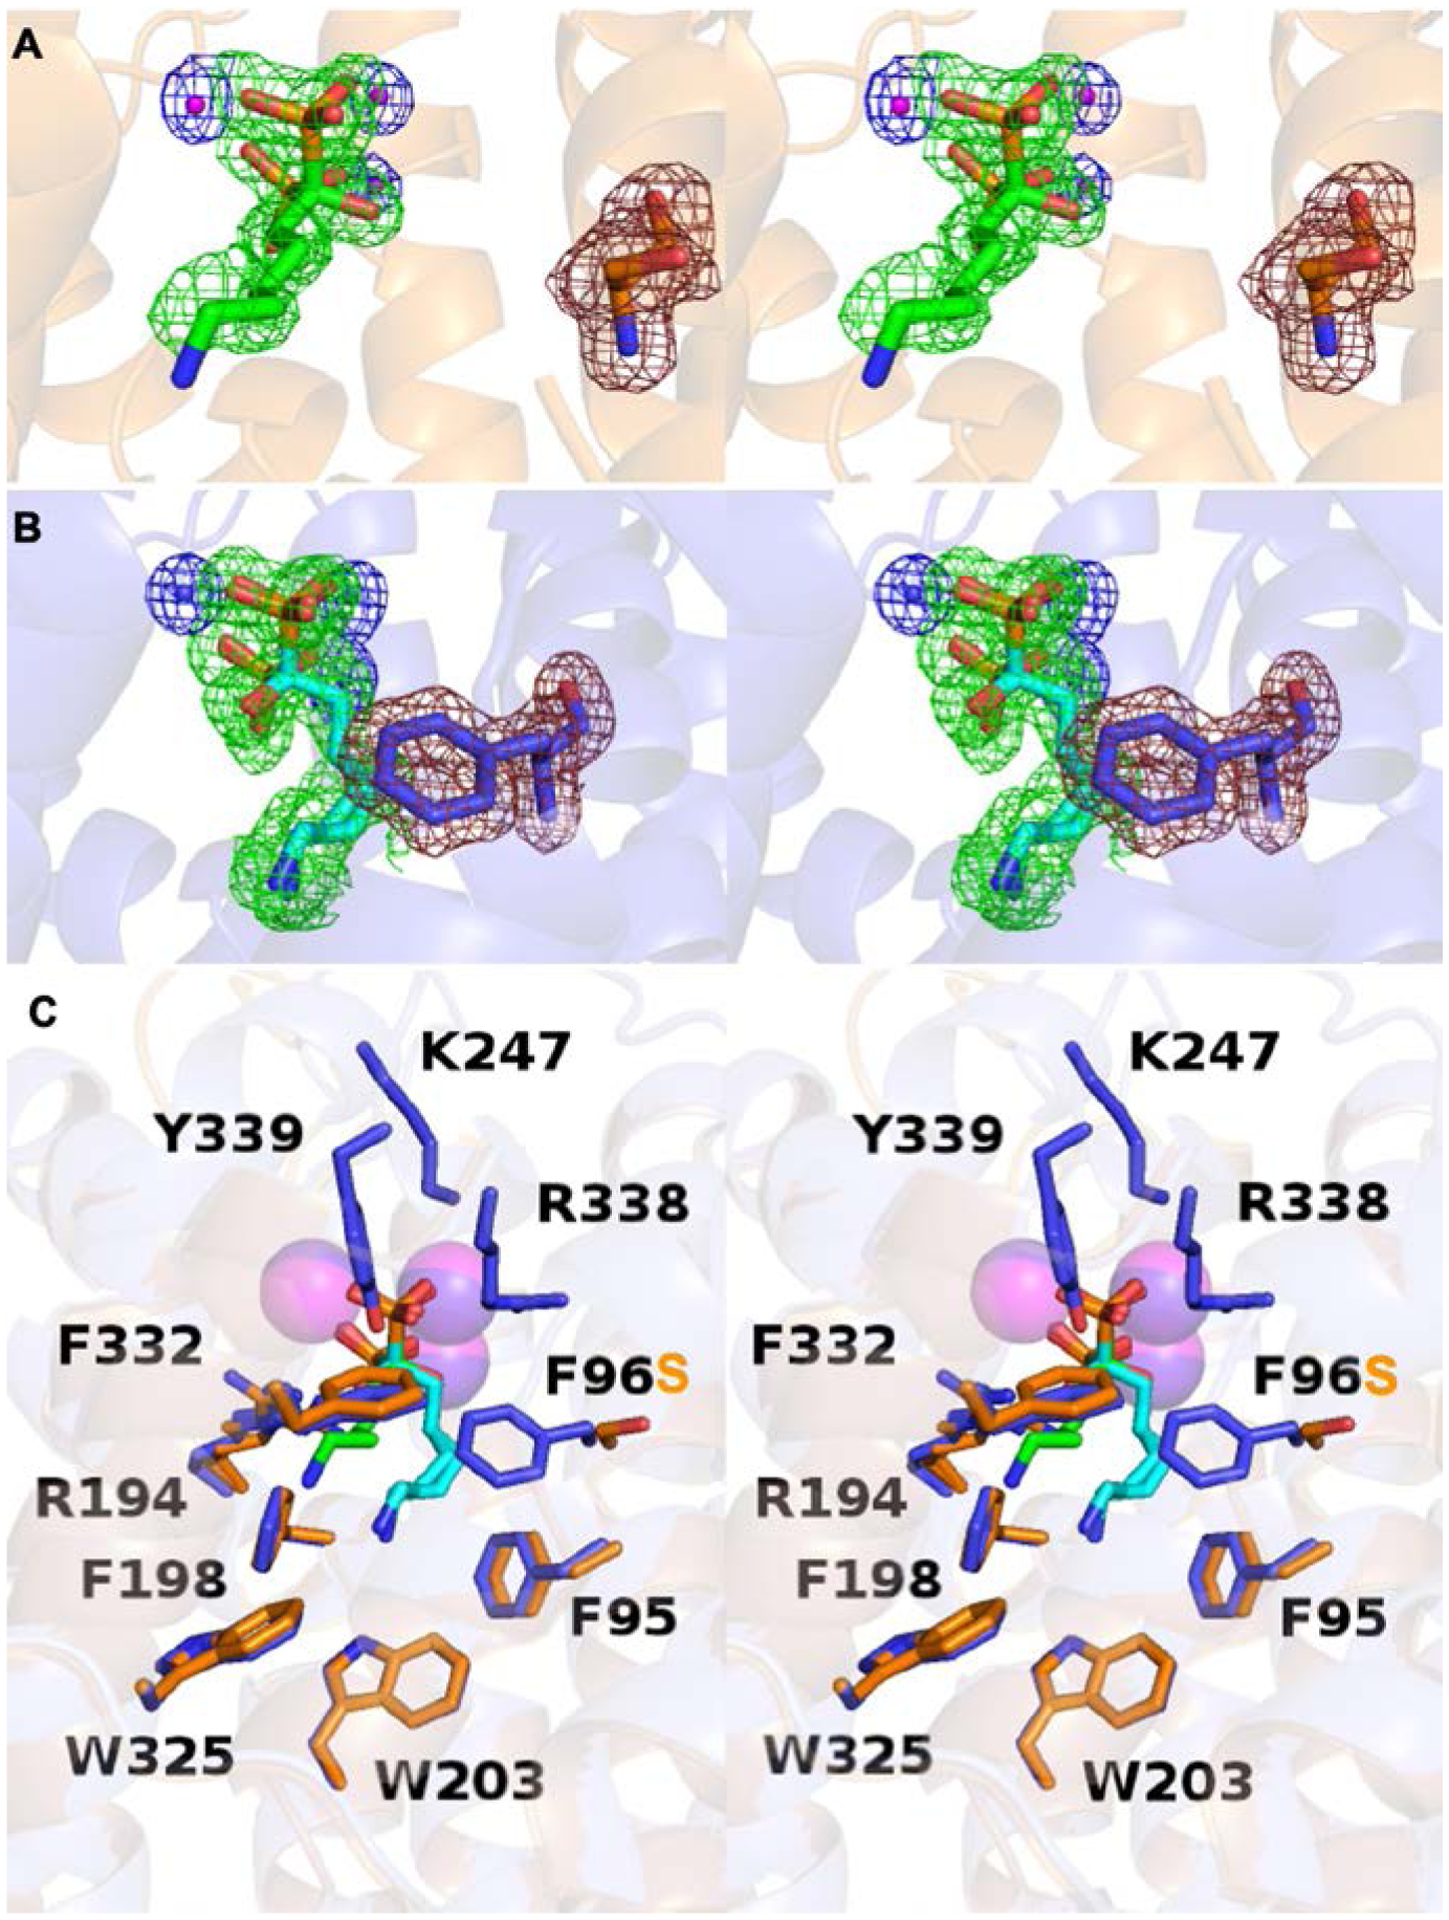
Figure 7.

(A) Stereoview of the F96S EIZS–Mg2+3–neridronate complex, showing Polder omit maps of neridronate (green mesh, 3σ), Mg2+ ions (blue mesh, 4σ), and S96 (ruby mesh, 4σ). Atoms are color coded as follows: C = orange (protein) or green (risedronate); N = blue; O = red; P = orange; Mg2+ ions = magenta spheres. (B) Stereoview of the wild-type EIZS–Mg2+3–neridronate complex, showing Polder omit maps of neridronate (green mesh, 3σ), Mg2+ ions (blue mesh, 4σ), and F96 (ruby mesh, 4σ). Atoms are color coded as follows: C = blue (protein) or cyan (risedronate); N = blue; O = red; P = orange; Mg2+ ions = blue spheres. (C) Stereoview showing the superposition of the F96S and wild-type EIZS–Mg2+3–neridronate complexes (blue and orange, respectively). Minimal structural differences are observed.
