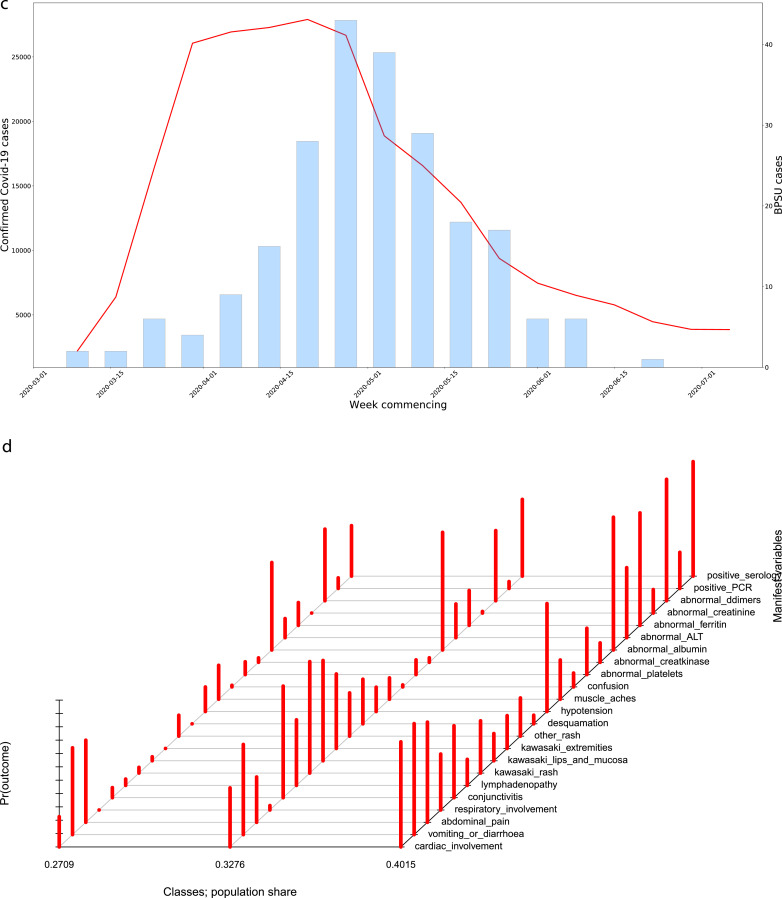
Fig. 2c.
(c) Confirmed COVID-19 cases in England alongside PIMS-TS cases by week of onset. Note different y-axes used. Left axes for confirmed COVID-19 cases, right axes for PIMS-TS cases. (d) Graphical representation of the latent class model identified from the PIMS-TS data. The red bars represent the conditional probability, by class, that a case will have a given organ system involvement or a positive PCR/serological test. The proportion of total cases falling into each class are given at the bottom of the figure. Bars l-R represent: Class 1, Class 2, Class 3.

