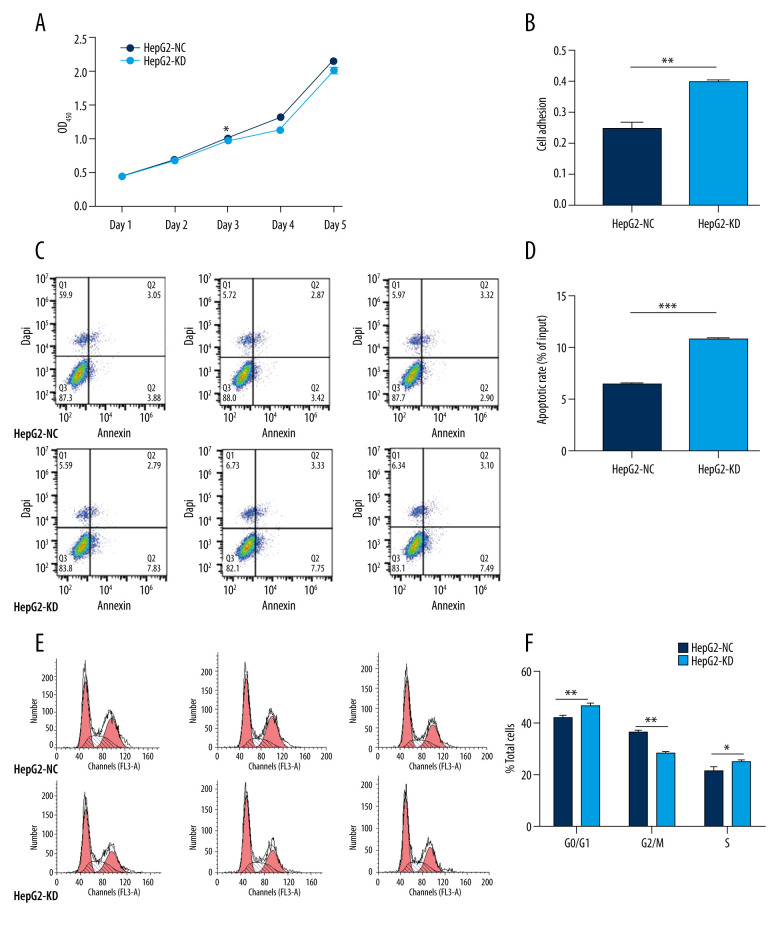
Figure 4.
In vitro knockdown of HHLA2 in HepG2 cells. HepG2 cells were transfected with lentivirus expressing HHLA2-targeting shRNA 1 (HepG2-KD) or control shRNA (HepG2-NC). (A) Cell proliferation was measured over time using the CCK-8 assay. * P<0.05. (B) Cell adhesion was measured as HepG2-KD group (0.400±0.009) compared with HepG2-NC group (0.247±0.034). ** P<0.01. (C) Flow cytometry dot plots showing apoptosis rates. (D) Quantification of apoptosis rates of HepG2-KD group (10.777±0.306) compared with HepG2-NC group (6.437±0.237). *** P<0.001. (E) Histograms showing numbers of cells in different stages of the cell cycle. (F) Quantification of percent of total cells in each stage of the cell cycle. * P<0.05, ** P<0.01.

