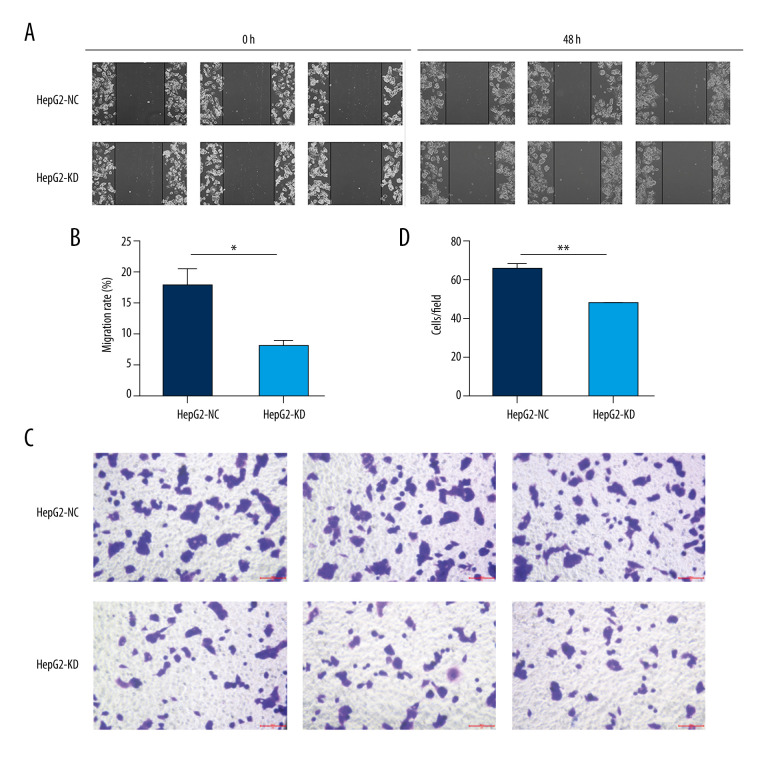
Figure 5.
Migration and invasion in HepG2 cells after knockdown of HHLA2. (A, B) Light micrographs images from the wound healing assay at 0 and 48 h and quantification of percent migration at 48 h. * P<0.05. (C, D) A transwell migration assay was performed, and cells in the lower chamber were stained with 1% crystal violet and quantified. Three fields were counted per well. ** P<0.01.

