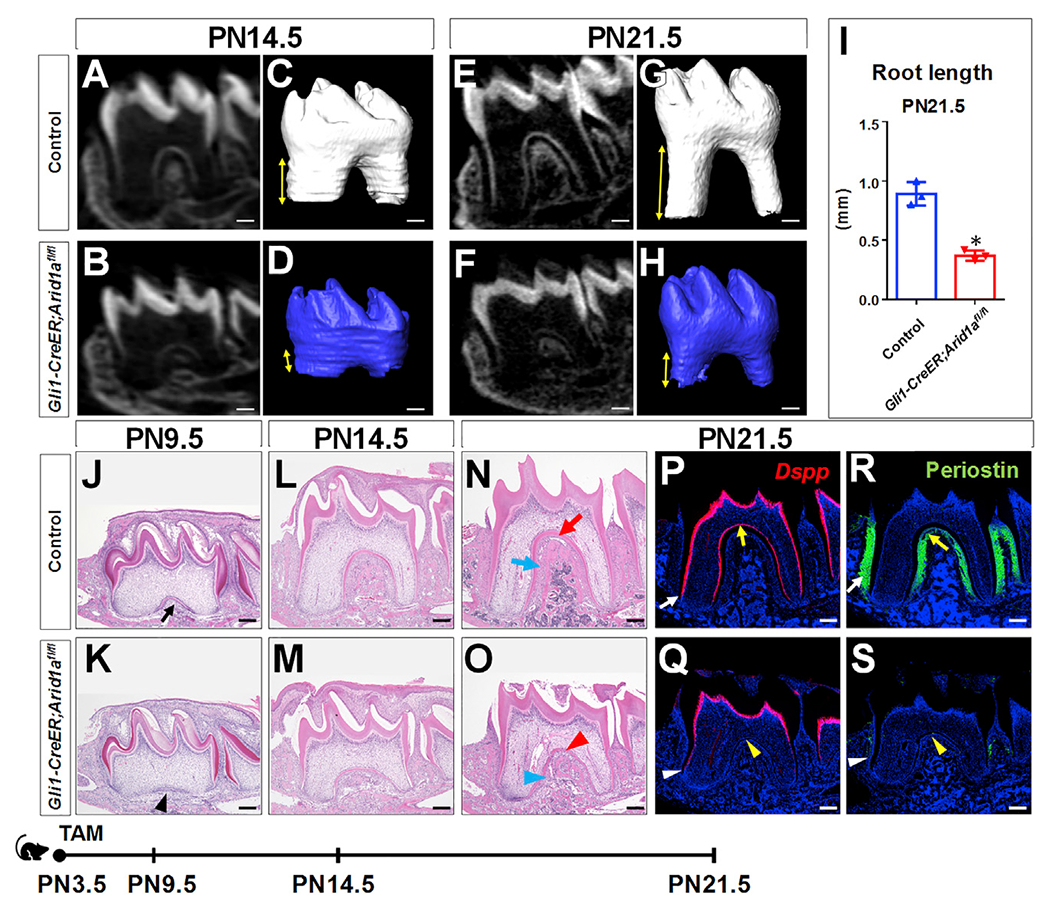
Figure 2. Loss of Arid1a in Gli1+ root progenitor cells leads to shortened roots.

(A–H) MicroCT 2D and 3D images of the first mandibular molars of control and Gli1-CreER;Arid1afl/fl mice at PN14.5 (A–D) and PN21.5 (E–H). Distance between arrowheads represents tooth root length.
(I) Quantitative analysis of tooth root length at PN21.5. n = 3, *p < 0.05.
(J–O) H&E staining of first mandibular molars of control and Gli1-CreER;Arid1afl/fl mice at PN9.5 (J and K), PN14.5 (L and M), and PN21.5 (N and O). Red and blue arrowheads in (O) indicate the compromised dentin and PDL in Gli1-CreER;Arid1afl/fl mice compared to control mice, respectively.
(P–S) In situ hybridization of Dspp (red; P and Q) and immunofluorescence of periostin (green; R and S) of first mandibular molars of control and Gli1-CreER;Arid1afl/fl mice at PN21.5. Yellow and white arrowheads in (Q) and (S), respectively, indicate absence of signal or compromised signal in the furcation region and the lateral region of the root in Gli1-CreER;Arid1afl/fl mice compared to control mice.
Schematic at the bottom indicates induction protocol. Data are represented as mean ± SD. Scale bars: 200 μm. See also Figures S1 and S2A.
