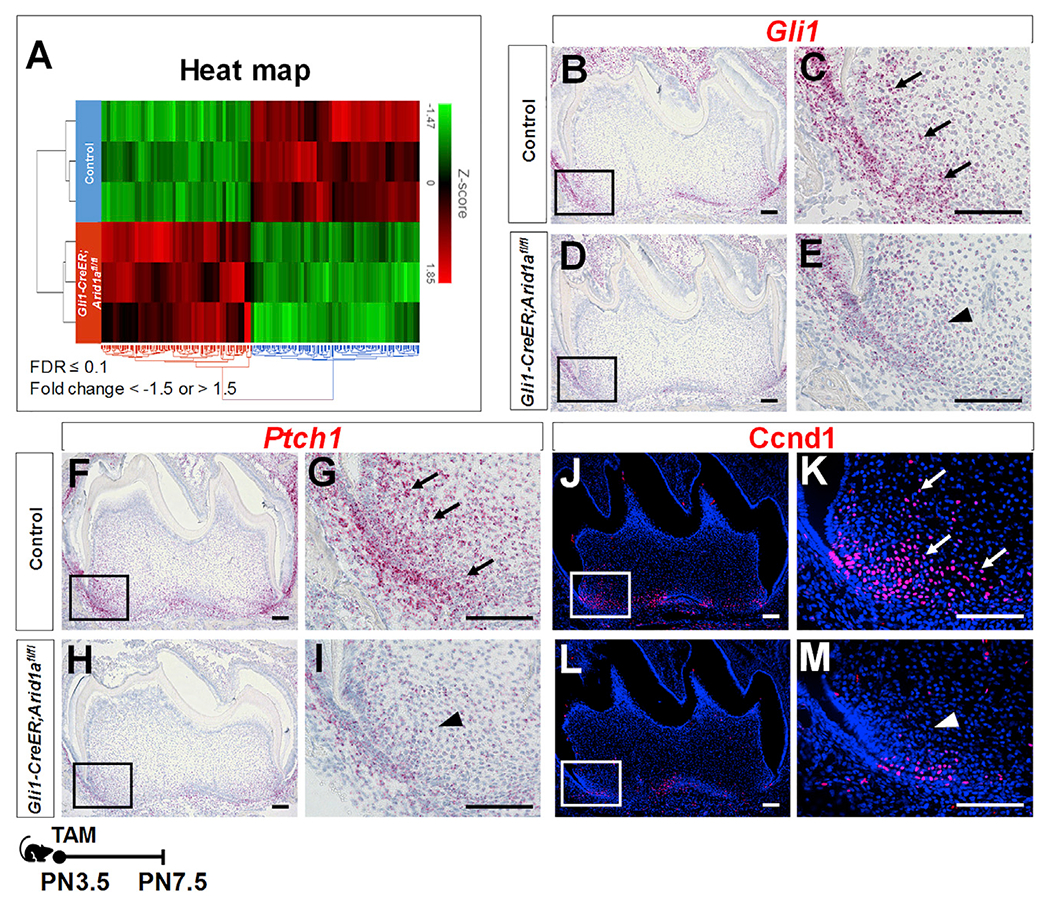
Figure 4. Loss of Arid1a in Gli1+ root progenitor cells leads to downregulated Hh signaling activity.

(A) Heatmap hierarchical clustering showing the gene expression profiles in the apical regions of control and Gli1-CreER;Arid1afl/fl mouse molars at PN7.5.
(B–M) RNAscope in situ hybridization (red) of Gli1 (B–E), Ptch1 (F–I), and immunofluorescence of Ccnd1 (red, J–M) of first mandibular molars of control and Gli1-CreER;Arid1afl/fl mice at PN7.5. The boxed areas are enlarged on the right. Arrows indicate positive signals in control group; arrowheads indicate reduced signal in targeted region of Gli1-CreER;Arid1afl/fl mouse molars.
Schematic at the bottom indicates induction protocol. Scale bars: 100 μm. See also Figures S4 and S5.
