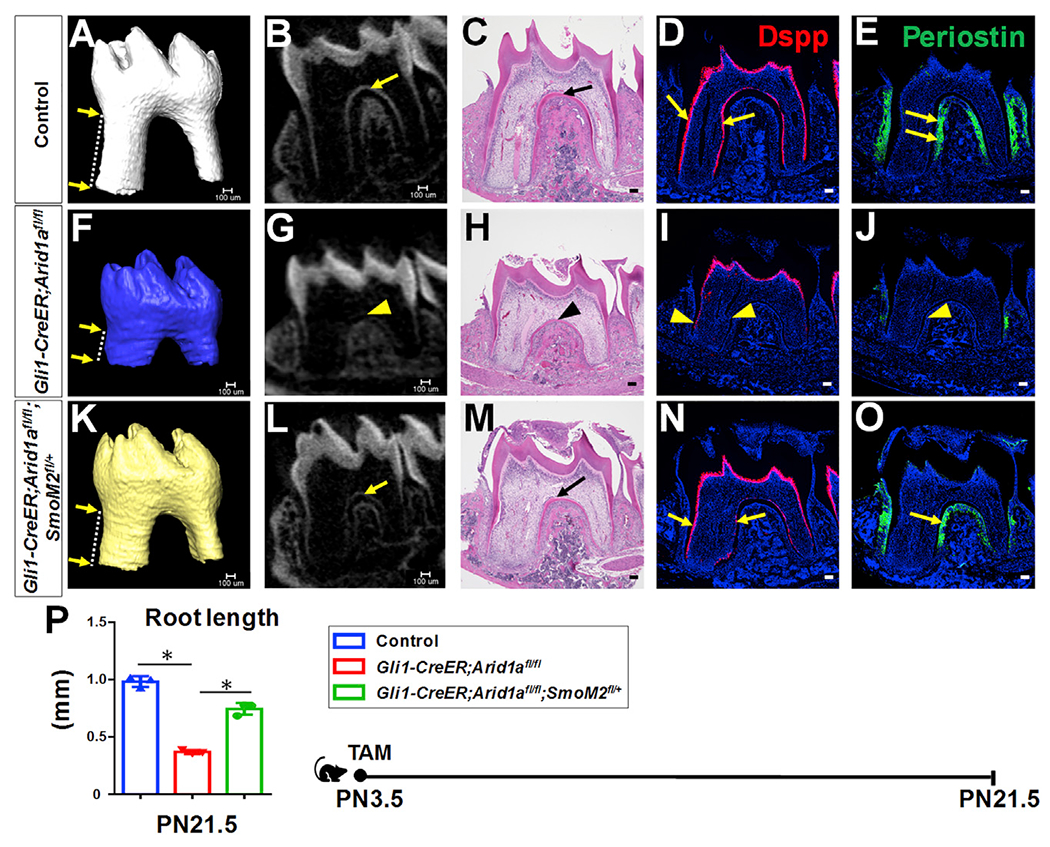
Figure 5. Upregulation of Hh signaling partially rescues tooth root defects in Gli1-CreER;Arid1afl/fl mouse molars.

(A–O) MicroCT 3D and 2D images, H&E staining, RNAscope in situ hybridization of Dspp (red), and immunofluorescence of periostin (green) of first mandibular molars in control (A–E), Gli1-CreER; Arid1afl/fl (F–J), and Gli1-CreER;Arid1afl/fl;SmoM2fl/+ (K–O) mice at PN21.5 after induction at PN3.5. Distance between two arrows in (A), (F), and (K) indicates tooth root length. Arrows in (B)–(E) and (L)–(O) indicate positive signals in control and Gli1-CreER;Arid1afl/fl;SmoM2fl/+ mice; arrowheads in (G)–(J) indicate compromised signal in targeted region of Gli1-CreER;Arid1afl/fl mouse.
(P) Quantification of length of first mandibular molar roots from control, Gli1-CreER;Arid1afl/fl, and Gli1-CreER;Arid1afl/fl;SmoM2fl/+ mice at PN21.5 after induction at PN3.5. n = 3, *p < 0.05.
Schematic at the bottom indicates induction protocol. Data are represented as mean ± SD. Scale bars: 100 μm. See also Figure S6.
