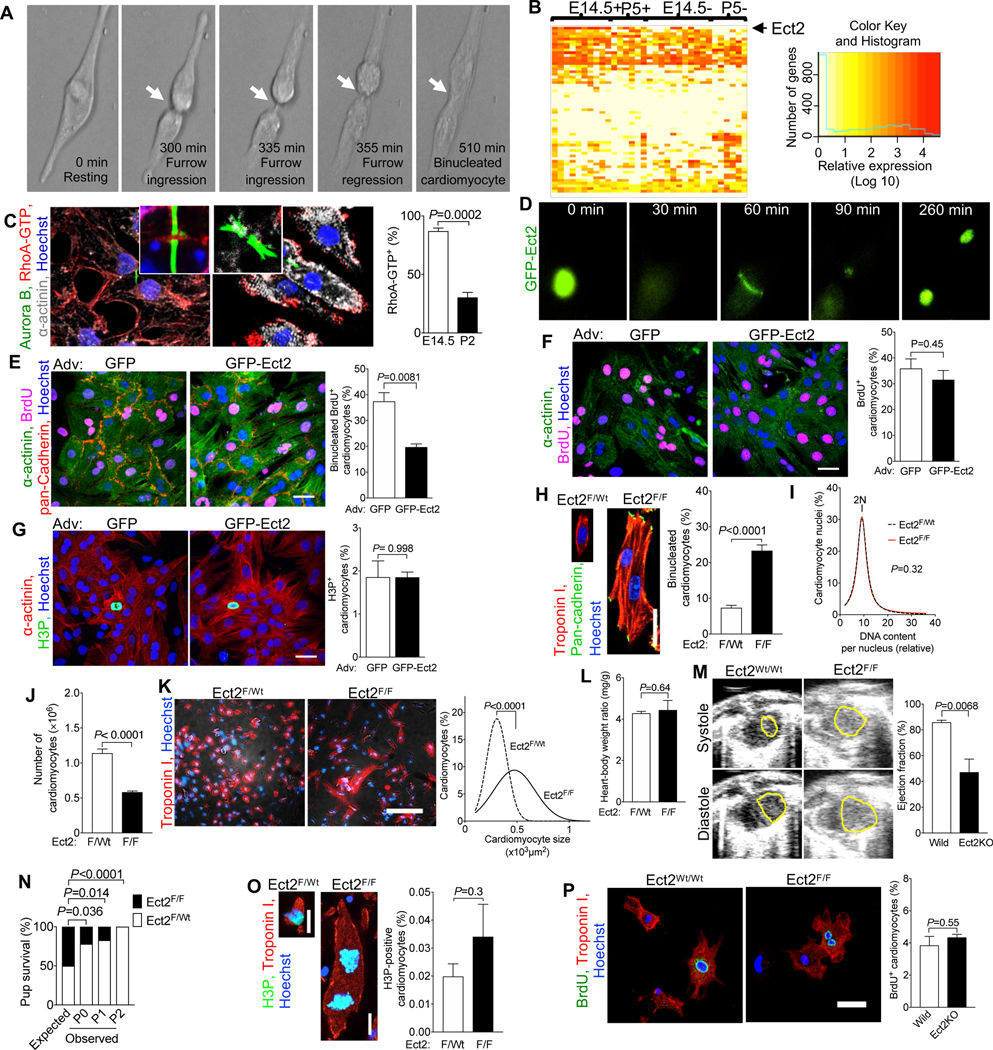
Figure 2. Ect2 levels regulate cardiomyocyte cytokinesis and Ect2 gene inactivation lowers endowment and is lethal in mice.

(A) Live cell imaging of neonatal rat cardiomyocytes (NRVM, P2-P3, 52 cardiomyocytes) shows that cleavage furrow regression precedes formation of binucleated cardiomyocytes, corresponding to Video S1. Cleavage furrow ingression is between 300–335 min, regression at 355 min, and formation of a binucleated cardiomyocyte at 510 min. (B) Transcriptional profiling of single cycling (+) and not cycling (−) cardiomyocytes at embryonic day 14.5 (E14.5) and 5 days after birth (P5) reveals that of 61 Dbl-homology family RhoGEF, Ect2 is significantly repressed in cycling P5 cardiomyocytes (P <0.05). (C) Binucleating cardiomyocytes exhibit lower RhoA activity (RhoA-GTP) at the cleavage furrow (E15.4: 59 midbodies; P2: n = 56 midbodies). (D-G) NRVM were transduced with Adv-CMV-GFP-Ect2. Live cell imaging shows appropriate and dynamic localization of GFP-ECT2 in cycling NRVM (D, corresponding to Video S4), reduced cytokinesis failure and reduced generation of binucleated cardiomyocytes. (F, G) Overexpression of GFP-Ect2 does not alter cardiomyocyte S- (F, GFP: n = 407; GFP-Ect2: n = 285) or M-phase (G, GFP: n = 432; GFP-Ect2: n = 443). (H-P) Ect2 gene inactivation in the αMHC-Cre; Ect2F/F mice at P1 (H-O) showed increased binucleated cardiomyocytes (H, Ect2F/wt n = 6, Ect2F/F n = 6 hearts) without change of DNA content per nucleus (I, Ect2F/wt n = 642 cardiomyocytes, Ect2F/F n = 647 cardiomyocytes), and a 50% lower cardiomyocyte endowment (J, Ect2F/wt n = 12, Ect2F/F n = 5 hearts). The reduced endowment triggers compensatory cardiomyocyte hypertrophy (K, Ect2F/wt n = 1,138 cardiomyocytes from 6 hearts, Ect2F/F n = 1,015 cardiomyocytes from 6 hearts), without change of heart weight (L, Ect2F/wt n = 14, Ect2F/F n = 6 hearts). (M, N) The lower cardiomyocyte endowment leads to myocardial dysfunction at P0 (M, left ventricular endocardium outlined in yellow, Ect2wt/wt n = 4, Ect2F/F n = 3 mice) and lethality before P2 (N, Video S5), but does not alter the M-phase (O, Ect2F/wt n = 6, Ect2F/F n = 6 hearts) and cell cycle entry (P, BrdU uptake, Ect2flox gene inactivation with αMHC-MerCreMer, tamoxifen DOL 0, 1, 2, followed by 3 days culture). Statistical significance was tested with Student’s t- test if not specified, and Fisher’s exact test (N). Scale bars 30 μm (E, P), 50 μm (F, G), 100 μm (K).
