
Figure 6.
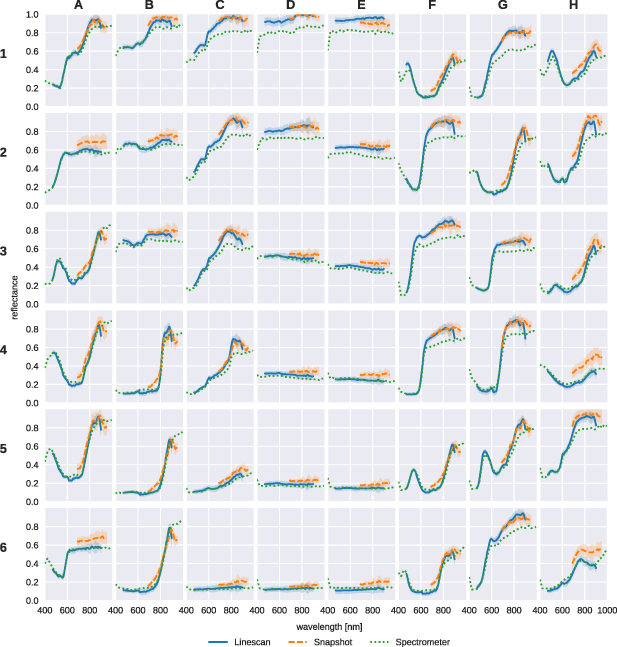
Comparison of measured reflectance curves between the linescan and snapshot iHSI camera systems and the reference spectrometer for each of the 48 colour patches. For both linescan and snapshot camera, mean and standard deviation of reflectance measurements within the manually segmented regions are shown.