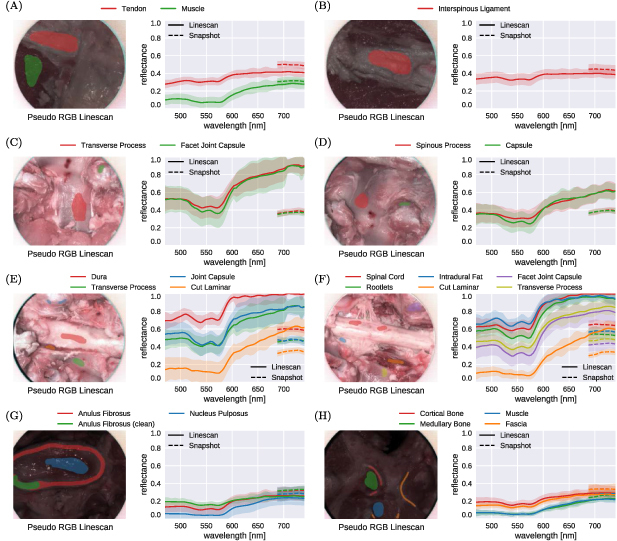
Figure 9.

Comparison of reflectance curve measurements between 470 and 740 nm associated with ex vivo tissue sample imaging of eight different anatomical scenes shown in figure 7(b) using the proposed iHSI system with linescan and snapshot cameras. For each camera, both the mean and standard deviation of reflectance measurements within the manually segmented regions are shown. Relative distribution and qualitative behaviour of reflectance values across tissue types between the cameras are well aligned. However, quantitative measurements of tissue reflectances between cameras generally deviate from each other likely due to different white balancing requirements associated with imaging multiple anatomical regions during the experiment.
