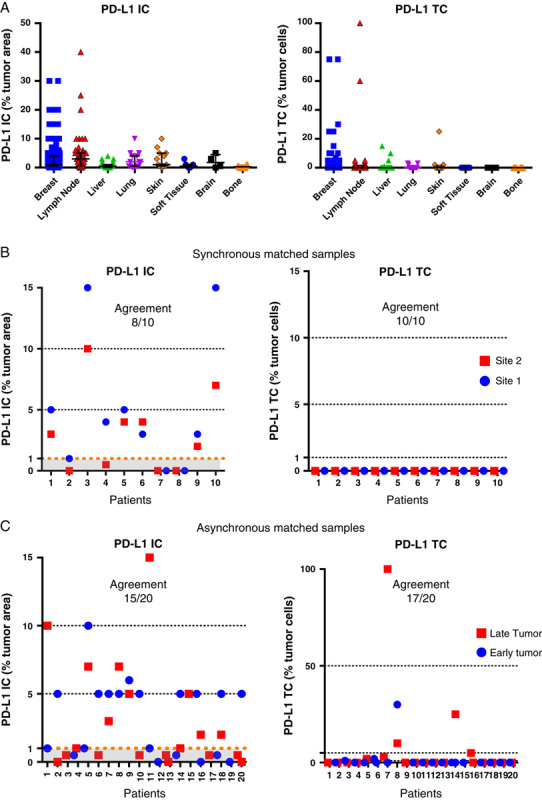
FIGURE 4.

Prevalence of PD-L1 IC and TC by anatomic location and in paired matched samples collected synchronously or asynchronously. Expression of PD-L1 by anatomic location as a continuum variable (A). PD-L1 on IC and TC was evaluated in samples collected at the same time (B) or at different times (C). The dotted lines discriminate the PD-L1 subgroups by their respective cutoffs. “Late” versus “Early” were classified relative to dates of sample collection. IC indicates immune cells; PD-L1, programmed death ligand 1; TC, tumor cells.
