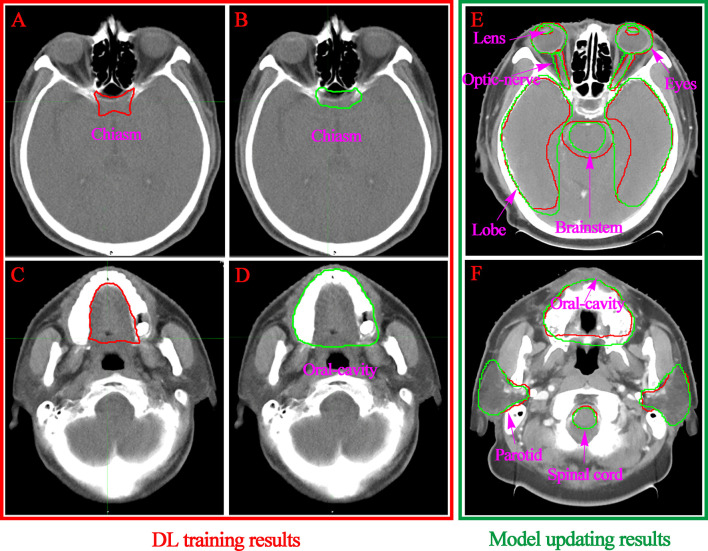
Figure 5.
Visualization of the convolution neural network-based segmentation results of the chiasm (A, B) and oral cavity (C, D). The DL performance of the OARs with model updating are listed in the right column (E, F). The ground truth segmentations are depicted in red, and the auto segmentations are depicted in green.

