. 2021 Apr 12;12(19):6488–6506. doi: 10.1039/d1sc00045d

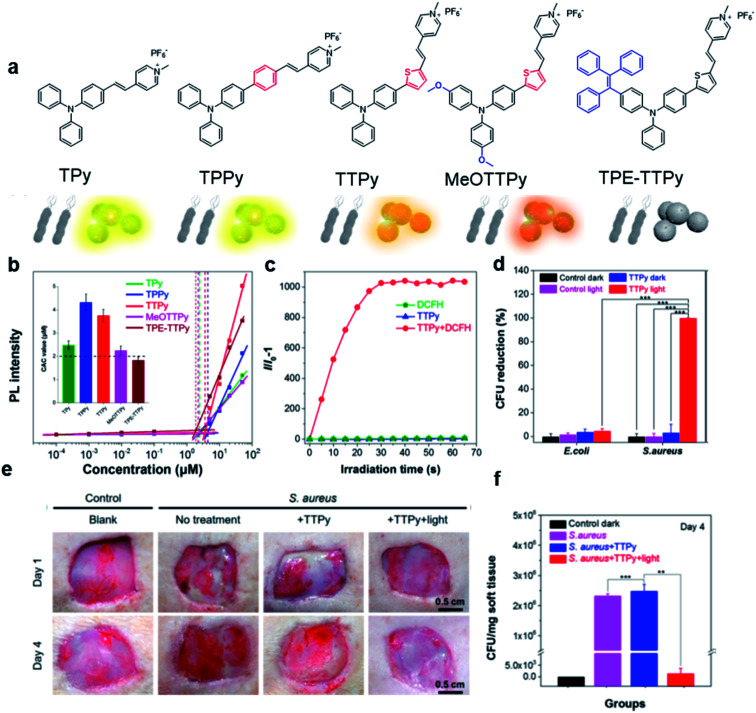
Fig. 11. (a) Molecular structures of TPy, TPPy, TTPy, MeOTTPy, and TPE-TTPy. (b) Plots of fluorescence intensities of AIEgens versus dye concentrations in PBS solution. Inset: Corresponding statistical histogram of the critical aggregation concentrations (CAC) of AIEgens. (c) ROS generation of TTPy (1 μM) upon white light irradiation using dichlorofluorescin (DCFH) as an indicator, where I0 and I are fluorescence intensities of DCFH before and after light irradiation. (d) Colony-forming unit (CFU) reduction of E. coli and S. aureus with/without TTPy (2 μM) and white light (60 mW cm−2) treatment. (e) Photographs of S. aureus-infected wounds after treatment with TTPy with/without white light irradiation (60 mW cm−2) on day 1 and day 4 post-infection. (f) Statistical histogram of bacterial colonies on the agar plates originating from the infected sites on rats with different treatments. Reproduced from ref. 75 with permission. Copyright 2019 American Chemical Society.

Fig. 11