
Fig. 8.
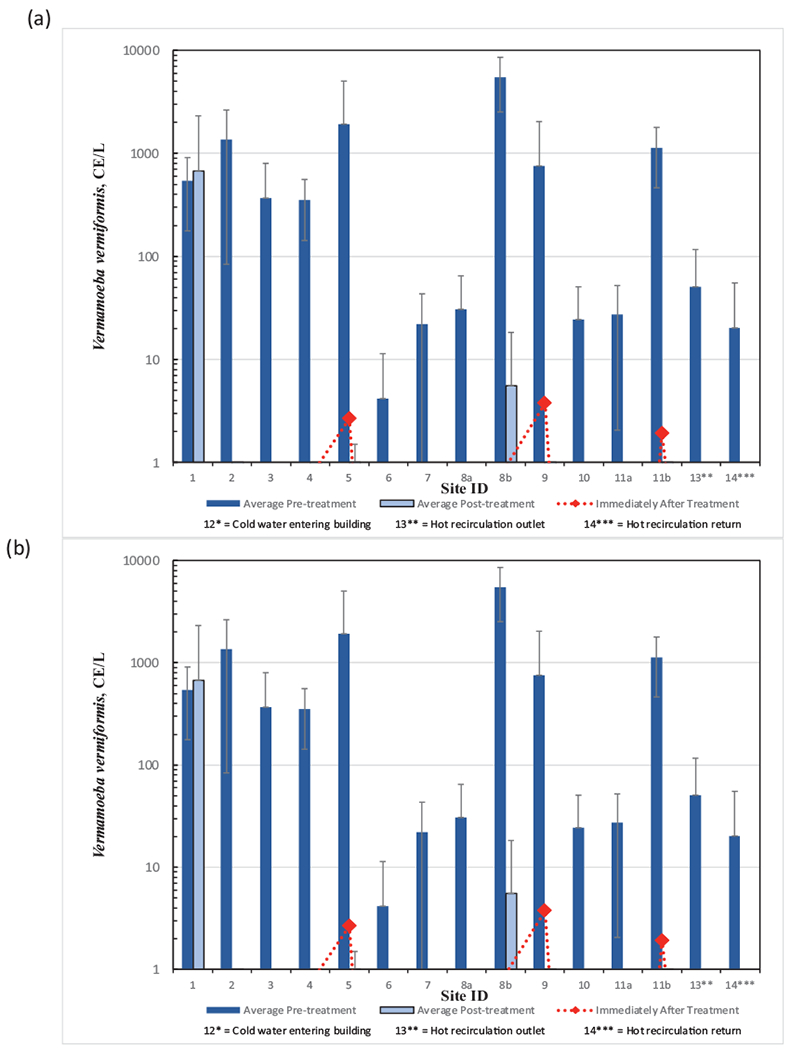
Results from qPCR analysis of water samples at locations before and after monochloramine treatment (a) Pseudomonas aeruginosa, and (b) Vermamoeba vermiformis. Immediately after treatment refers to within 48 h after monochloramine startup. Site 12, municipal drinking water entering the hospital, did not have detections and is not shown. Non-detect data points below 1 CE/L are not shown. Error bars represent standard deviations.