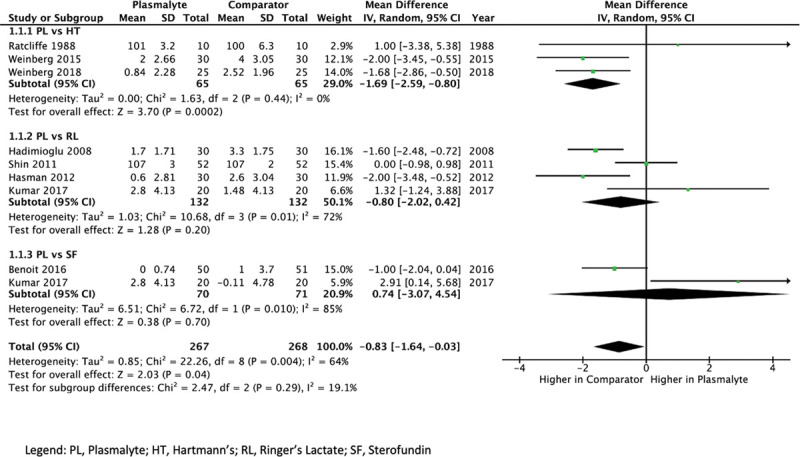
Figure 1.

Forest plot of mean difference of chloride concentration postinfusion of Plasmalyte (PL) versus any comparator. HT = Hartmann’s, RL = Ringer’s Lactate, SF = Sterofundin.

Forest plot of mean difference of chloride concentration postinfusion of Plasmalyte (PL) versus any comparator. HT = Hartmann’s, RL = Ringer’s Lactate, SF = Sterofundin.