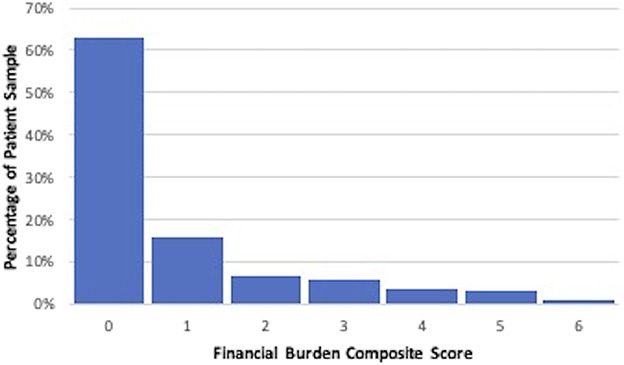
Fig. 1.

This bar graph shows the distribution of composite scores for financial burden. A score of 0 represents the lowest possible financial burden and a score of 6 represents the highest possible financial burden.

This bar graph shows the distribution of composite scores for financial burden. A score of 0 represents the lowest possible financial burden and a score of 6 represents the highest possible financial burden.