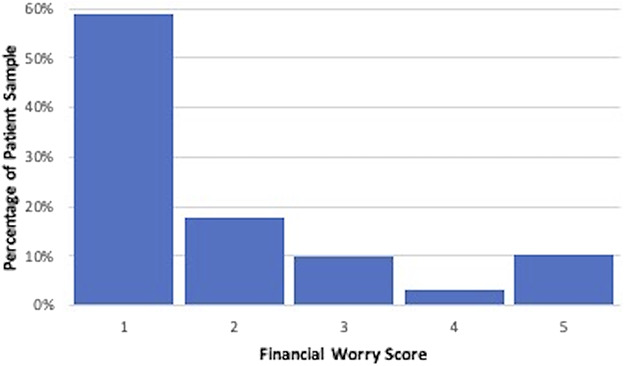
Fig. 2.

This bar graph shows the distribution of scores for financial worry. A score of 1 represents the lowest level of financial worry and a score of 5 represents the highest level of financial worry. In this figure, “low worry” is indicated by a patient answering 1, 2, or 3 on the Likert scale; in contrast, “high worry” is indicated by a 4 or 5 on the Likert scale.
