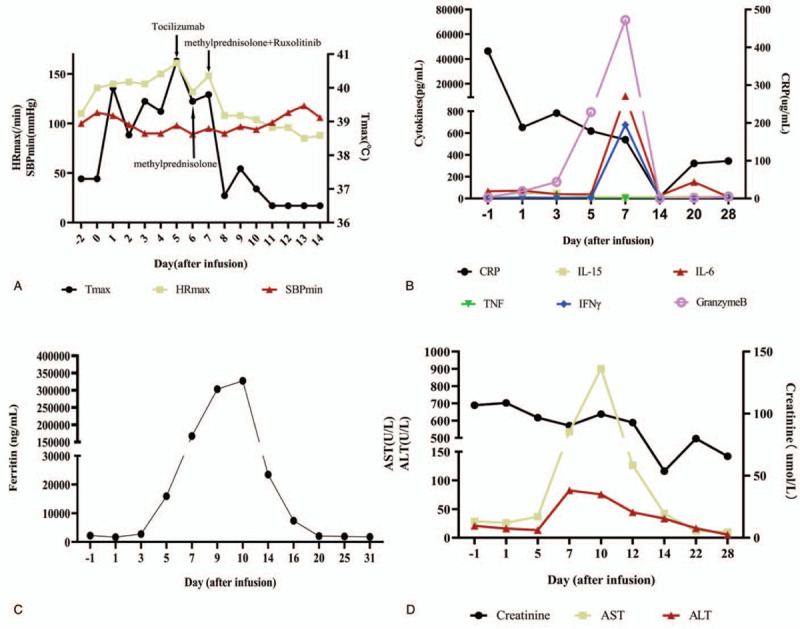
Figure 1.

Clinical parameters of the patient. A: The graph shows the patient's maximum temperature (Tmax), maximum heart rate (HRmax), minimum systolic blood pressure (SBPmin), and the administration of different drugs. B: Serum cytokines levels before and during treatment. C: Ferritin levels before and during treatment. D: The AST/ALT and creatinine. ALT = alanine aminotransferase, AST = aspartate aminotransferase.
