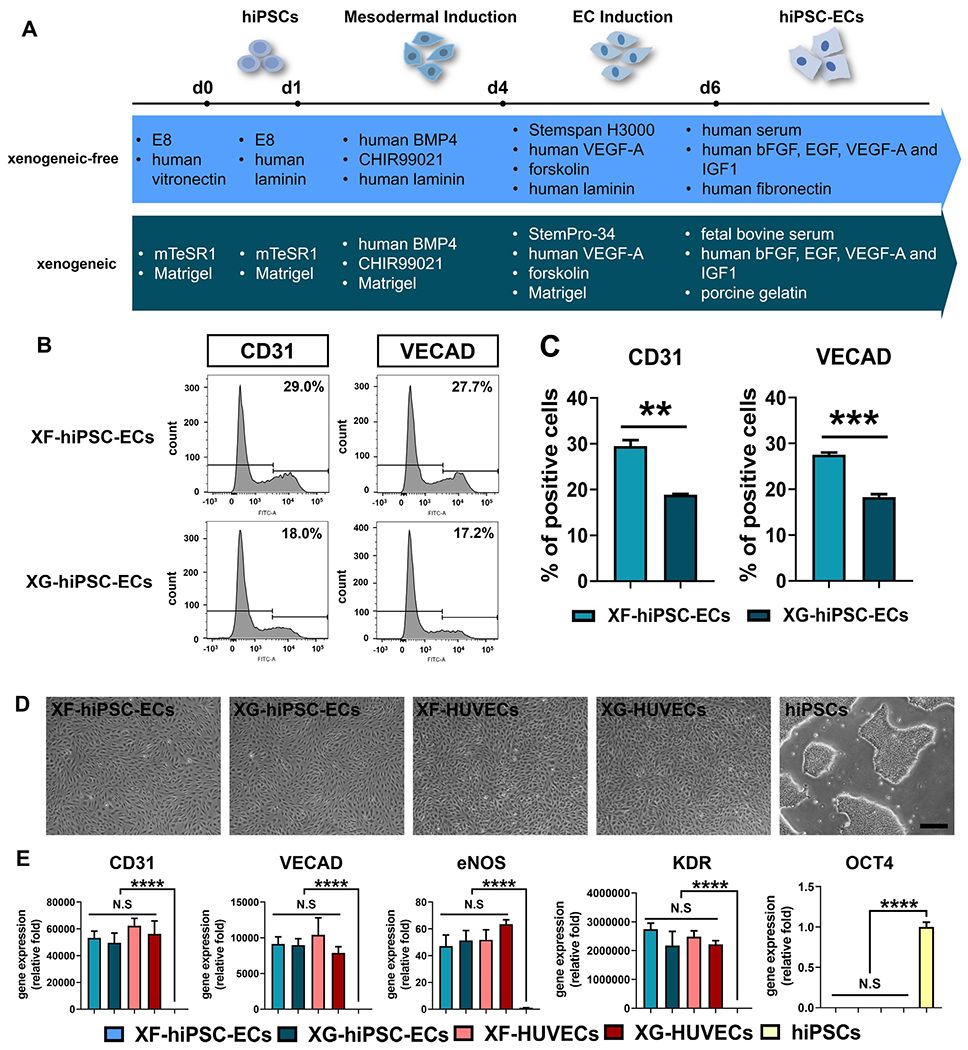
Figure 1.

Derivation of hiPSC-ECs under xenogeneic-free conditions. (A) Schematic illustration of EC differentiation of hiPSCs under xenogeneic-free or xenogeneic conditions. Essential reagents utilized in both methods are listed. See Materials and Methods and Table S2 for details of the methods. BMP4: bone morphogenetic protein 4, 25 ng/mL for xenogeneic-free and xenogeneic mesodermal induction (day1-4); CHIR99021: glycogen synthase kinase (GSK) 3 inhibitor, 6 μM for xenogeneic-free and xenogeneic mesodermal induction (day1-4); VEGF-A: vascular endothelial growth factor A, 200 ng/mL for xenogeneic-free and xenogeneic EC induction (day 4-6) and 50 ng/mL for xenogeneic-free and xenogeneic hiPSC-EC expansion (day 6 and later); forskolin: 2 μM for xenogeneic-free and xenogeneic EC induction (day 4-6); FGF2: fibroblast growth factor 2, 10 ng/mL for xenogeneic-free hiPSC-EC expansion (day 6 and later); EGF: epithelial growth factor, 5 ng/mL for xenogeneic-free hiPSC-EC expansion (day 6 and later); IGF1: insulin growth factor 1, 20 ng/mL for xenogeneic-free hiPSC-EC expansion (day 6 and later). (B) Representative plots of percentage of CD31-positive or VE-cadherin (VECAD)-positive XF-hiPSC-ECs or XG-hiPSC-ECs by flow cytometry analysis. (C) Quantification of percentage of CD31-positive or VE-cadherin (VECAD)-positive XF-hiPSC-ECs or XG-hiPSC-ECs by flow cytometry analysis. (Two-tailed unpaired Student’s T-test; Mean values and S.E.M indicated by the error bars are shown; n=3; N.S: not significant). (D) Bright field images of hiPSC-ECs and human primary ECs cultured under xenogeneic-free or xenogeneic conditions (XF-hiPSC-ECs, XG-hiPSC-ECs, XF-human umbilical venous endothelial cells [XF-HUVECs] and XG-HUVECs), and hiPSCs cultured under xenogeneic-free conditions. Scale bar: 200 μm. (E) Relative mRNA transcript amounts of EC markers (CD31, VECAD, eNOS and KDR) and pluripotency marker OCT4 in XF-hiPSC-ECs, XG-hiPSC-ECs, XF-HUVECs, XG-HUVECs, and hiPSCs cultured under xenogeneic-free conditions. Values in the y axis represent fold changes relative to human GAPDH expression. Gene expression in each group was normalized to that of hiPSCs (One-way ANOVA with Tukey’s multiple comparisons test; Mean values and S.E.M indicated by the error bars are shown; n=3; ****: p<0.0001; N.S: not significant).
