Figure 3.

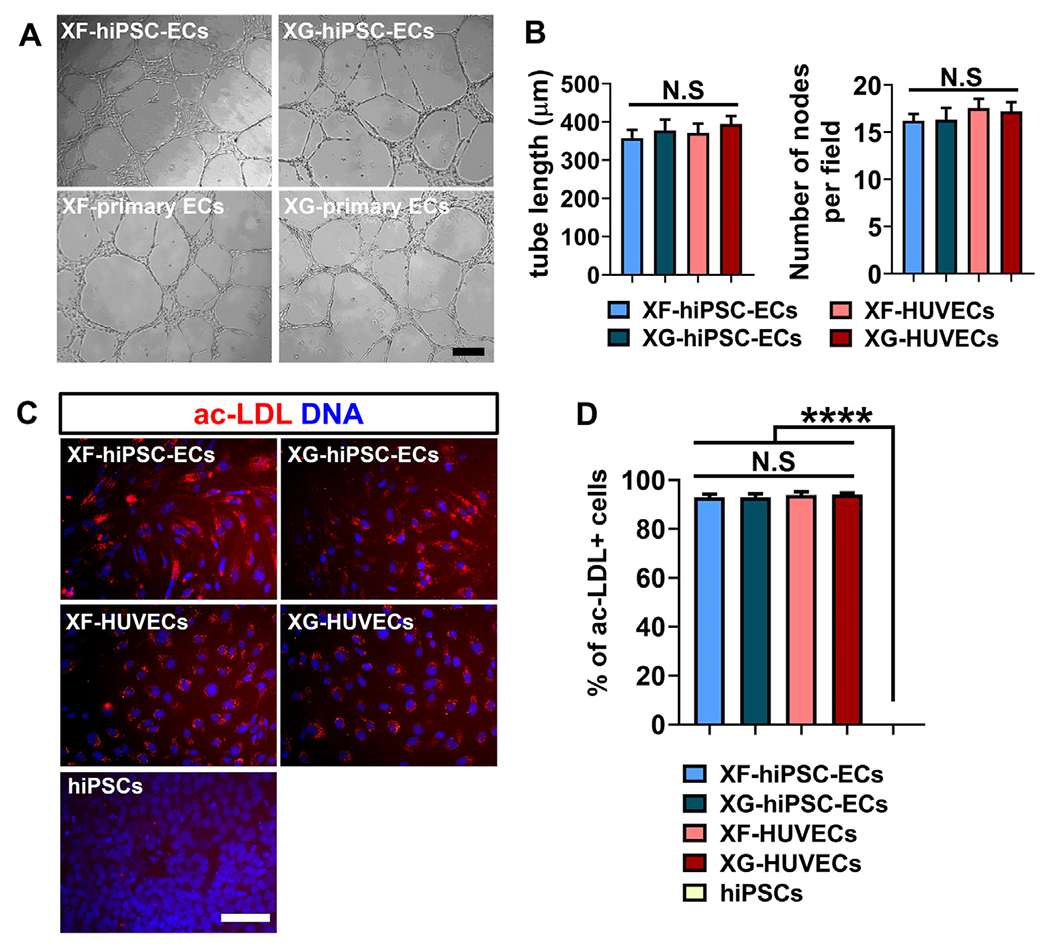
Endothelial functional analysis of XF-hiPSC-ECs. (A) Representative phase contrast images of capillary-like networks by hiPSC-ECs or HUVECs derived under xenogeneic-free or xenogeneic conditions (XF-hiPSC-ECs, XG-hiPSC-ECs, XF-HUVECs or XG-HUVECs) on Matrigel-coated culture plates 24 hours after cell seeding. Scale bar: 200 μm. (B) Quantification of tube length and number of nodes per field of cellular networks formed by XF-hiPSC-ECs, XG-hiPSC-ECs, XF-HUVECs or XG-HUVECs (One-way ANOVA with Tukey’s multiple comparisons test; Mean values and S.E.M indicated by the error bars are shown; n=3; N.S: not significant). (C) Uptake of fluorescently labelled acetylated low density lipoprotein (ac-LDL) in XF-hiPSC-ECs, XG-hiPSC-ECs, XF-HUVECs, XG-HUVECs or undifferentiated hiPSCs cultured under xenogeneic-free conditions. DNA (nuclear) was counterstained by DAPI. Scale bar: 200μm. (D) Quantification of percentage of cells positive for ac-LDL uptake in C (One-way ANOVA with Tukey’s multiple comparisons test; Mean values and S.E.M indicated by the error bars are shown; n=3; ****: p<0.0001; N.S: not significant).
