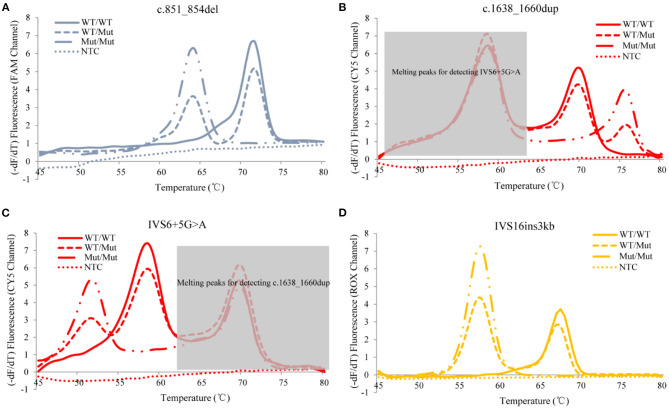
Figure 2.
Representative genotyping results of the four prevalent SLC25A13 mutations using the MMCA assay. Melting curves and fluorescence melting peaks, as well as corresponding genotypes, are provided according to the detection mutations above the panel [(A) c.851_854del; (B) c.1638_1660dup; (C) IVS6+5G>A; (D) IVS16ins3kb]. In each panel, melting curves are displayed in only one channel that is related to the detection mutation, and marked on the y-axis. The mutations are individually identified by their labeling fluorophores and Tm values, and all mutant alleles generate distinct melting peaks corresponding to the wild-type alleles. –dF/dT, the negative derivative of fluorescence over temperature; WT, wild-type; Mut, mutant; NTC, no DNA template control; MMCA, multicolor melting curve analysis.

