
FIGURE 7.
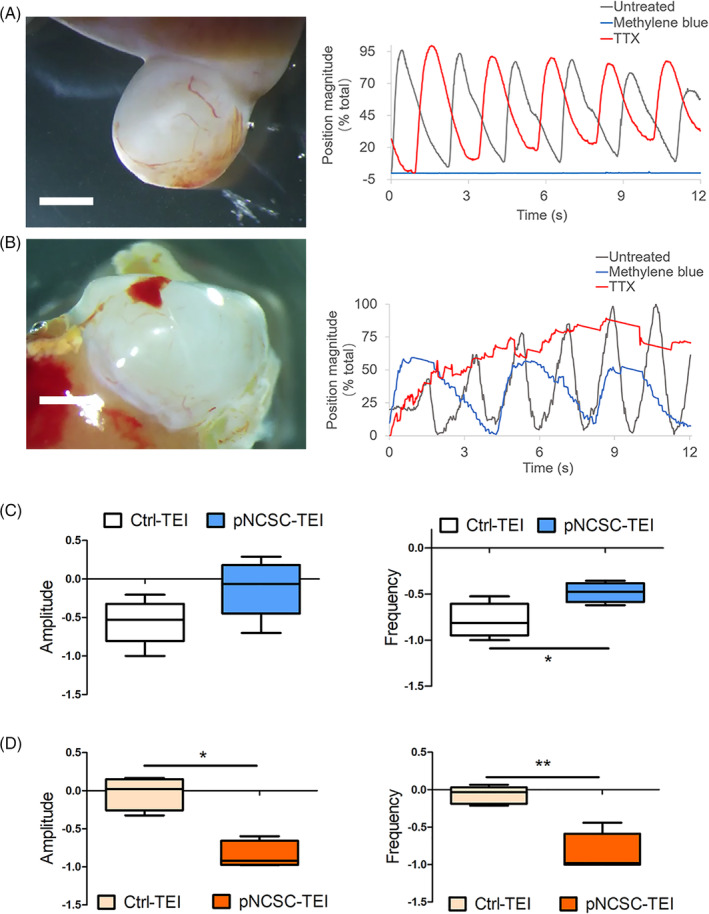
Motility analysis of control tissue‐engineered intestine and premigratory neural crest stem cells (pNCSCs‐TEI). A, In the motion analysis of Ctrl‐TEI, the gray curve represents spontaneous peristalsis and the red curve represents the peristalsis after TTX treatment. There is no obvious change compared with the treatment before (n = 5). The blue curve represents the peristalsis following methylene blue treatment, showing an obvious decline in the amplitude and frequency (n = 6) (see [Link], [Link]). B, In the motion analysis of pNCSCs‐TEI, the gray curve represents spontaneous peristalsis. The blue curve represents the peristalsis following treatment with methylene blue, showing a decreased but not blocked peristalsis. The red curve represents the peristalsis following TTX treatment, showing an obvious decline both in amplitude and frequency, especially the frequency (n = 5) (see [Link], [Link]). (A,B, right panel) X axis represents the recording time (s); the Y axis represents the position magnitude (% total). The Abscissa accompanying each curve is showed as the time (s) after 15× speed acceleration. Scale bar (A,B, left panel) = 2 mm. C, Comparison of the amplitude (left) and frequency (right) in Ctrl‐TEI and pNCSCs‐TEI after methylene blue treatment following automated point tracking. D, Comparison of the amplitude (left) and frequency (right) after TTX treatment. For box and whisker plots, the black line across the box represents the median, the box represents the interquartile range; and the whiskers represent the minimum and maximum. C,D, The Y axis represents rate of change after (Xa) and before (Xb) the treatment, that is, (Xa‐Xb)/Xb *P < .05, **P < .01, ***P < .001; Mann‐Whitney test