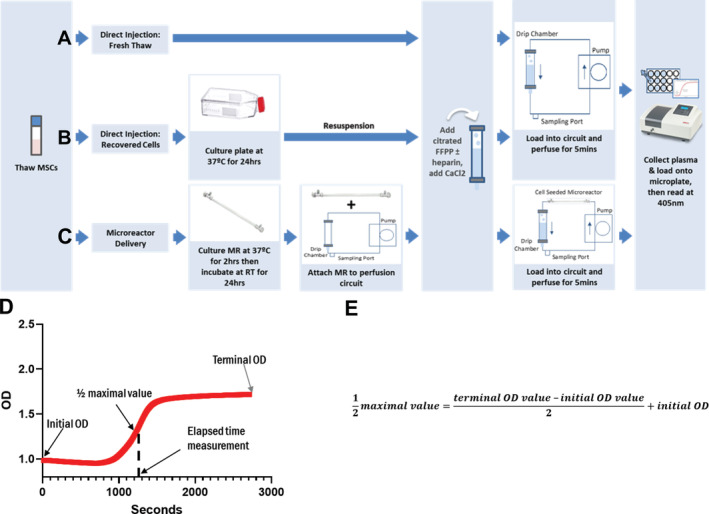
FIGURE 1.

Clot formation assay experimental setup. MSCs were thawed from cryopreservation and were either (A) immediately combined into fresh‐frozen pooled plasma‐based (FFPP), perfused in the circuit and read, (B) cultured for 24 hours then resuspended into FFPP, perfused in the circuit and read, or (C) seeded into micro bioreactors (MR), allowed to attach to the hollow‐fiber filters for 2 hours, room temperature incubated for 24 hours then attached to perfusion circuits loaded with FFPP, perfused and read. Perfusion of the MR circuits lasted 5 minutes before samples were collected and read on the spectrophotometer at 405 nm to assess fibrin formation. D, Resulting spectrophotometric optical density (OD) readouts were graphed over time. E, Formula used for the calculation of the clot formation time determined at the ½ maximal value
