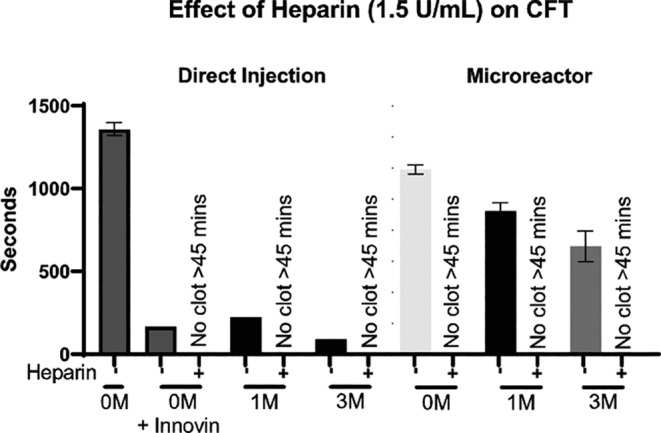
FIGURE 5.

Effect of heparin on CFT. 0, 1 × 10⁶, or 3 × 10⁶ (0 M, 1 M, 3 M) viable MSCs were isolated for inclusion in each respective group. MSCs for direct injection groups were thawed directly into plasma then used, while microreactor groups were seeded with MSCs and allowed to attach for 2 hours at 37°C followed by a 24‐hour hold at room temperature prior to perfusion. Innovin (thromboplastin) was added to the 0 M group as a positive control. After each groups' cells were prepared, warmed FFPP was perfused through circuit for 5 minutes then subjected to spectrophotometric measurements. Measurements of fibrin clot formation in plasma were made every 10 seconds over a 45‐minute period. Values for CFT were determined and resulting values were graphed and analyzed with an unpaired Student's t test. Samples which showed no increase in absorbance through the course of the experiment were designated to have not clotted. N ≥ 2 runs per group. *P < .05. Error bars represent ± SD
