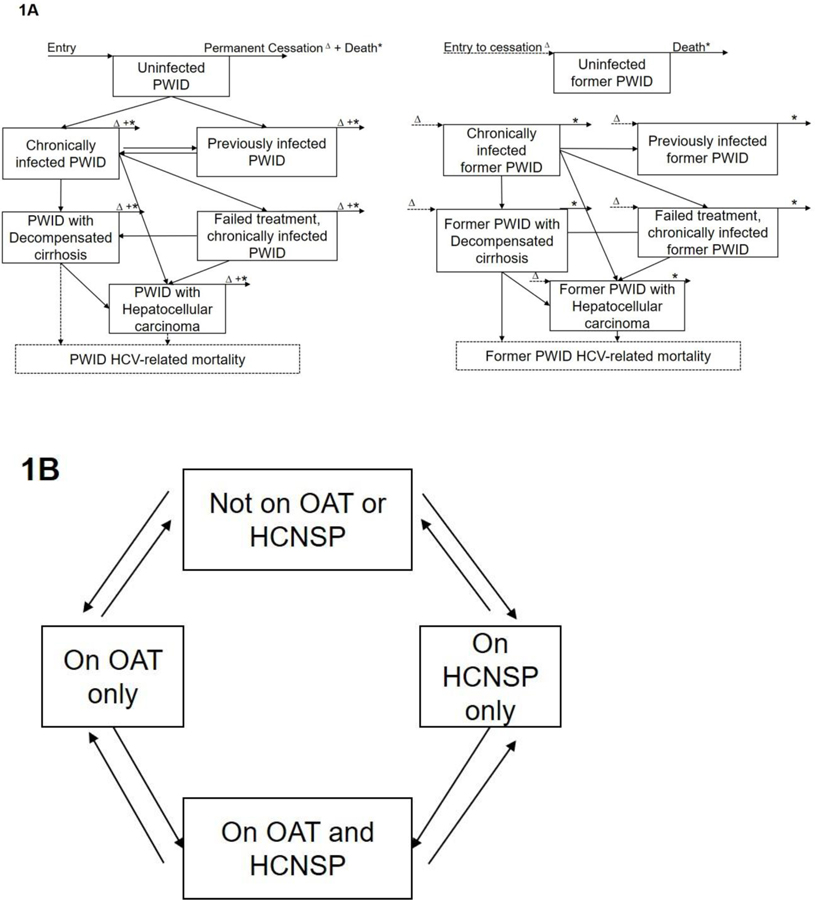
Figure 1. Model schematics showing (A) HCV disease progression by liver disease states and (B) stratification by harm reduction interventions.
PWID: People who inject drugs; OAT: Opiate agonist therapy; HCNSP: High coverage needle/syringe exchange program (receiving ≥1 sterile syringes per injection). *PWID exiting the model due to death; ∆Current PWID transitioning to former PWID model, resulting from permanent cessation.

