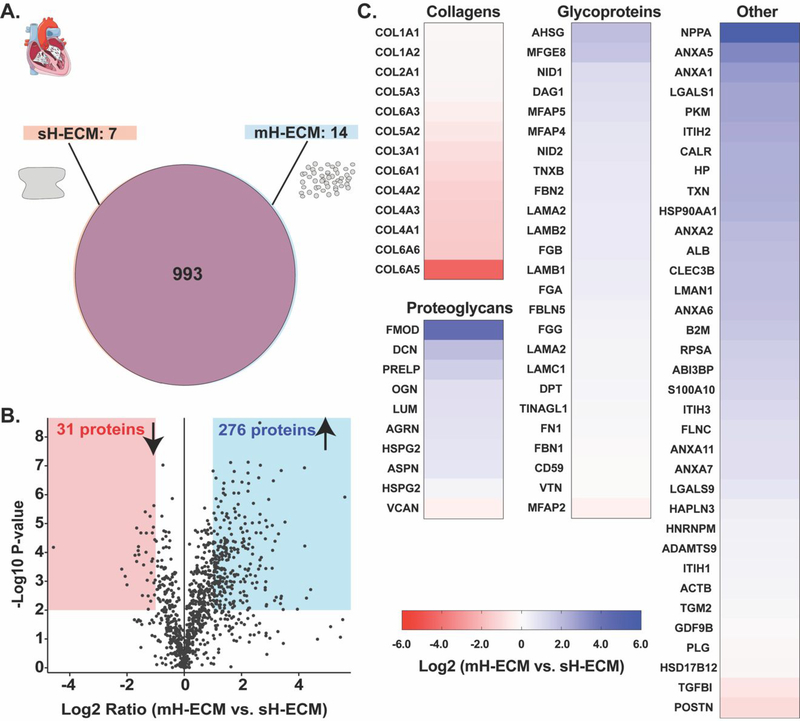
Figure 5. Discovery proteomics.
A.) Venn diagram representing the overall number of proteins identified per condition (n=3). B.) Volcano plot representing in the x-axis the Log2 ratio for the identified proteins according to the label-free quantification analysis and the y-axis the −Log10 P-value according to the statistical analysis considering a false discovery rate of 0.01. The red shadow area corresponds to the statistically significant area for less abundant proteins identified (i.e., Log2 ratio<1 & P-value<0.01). The blue area corresponds to the statistically significant area for the identified proteins with higher abundance (i.e., Log2 ratio>1 & P-value>0.01). C.) Heatmaps showing the abundance ratio as fold change between automated mH-ECM and manual sH-ECM for collagens, proteoglycans, glycoproteins, and other ECM-related proteins.

