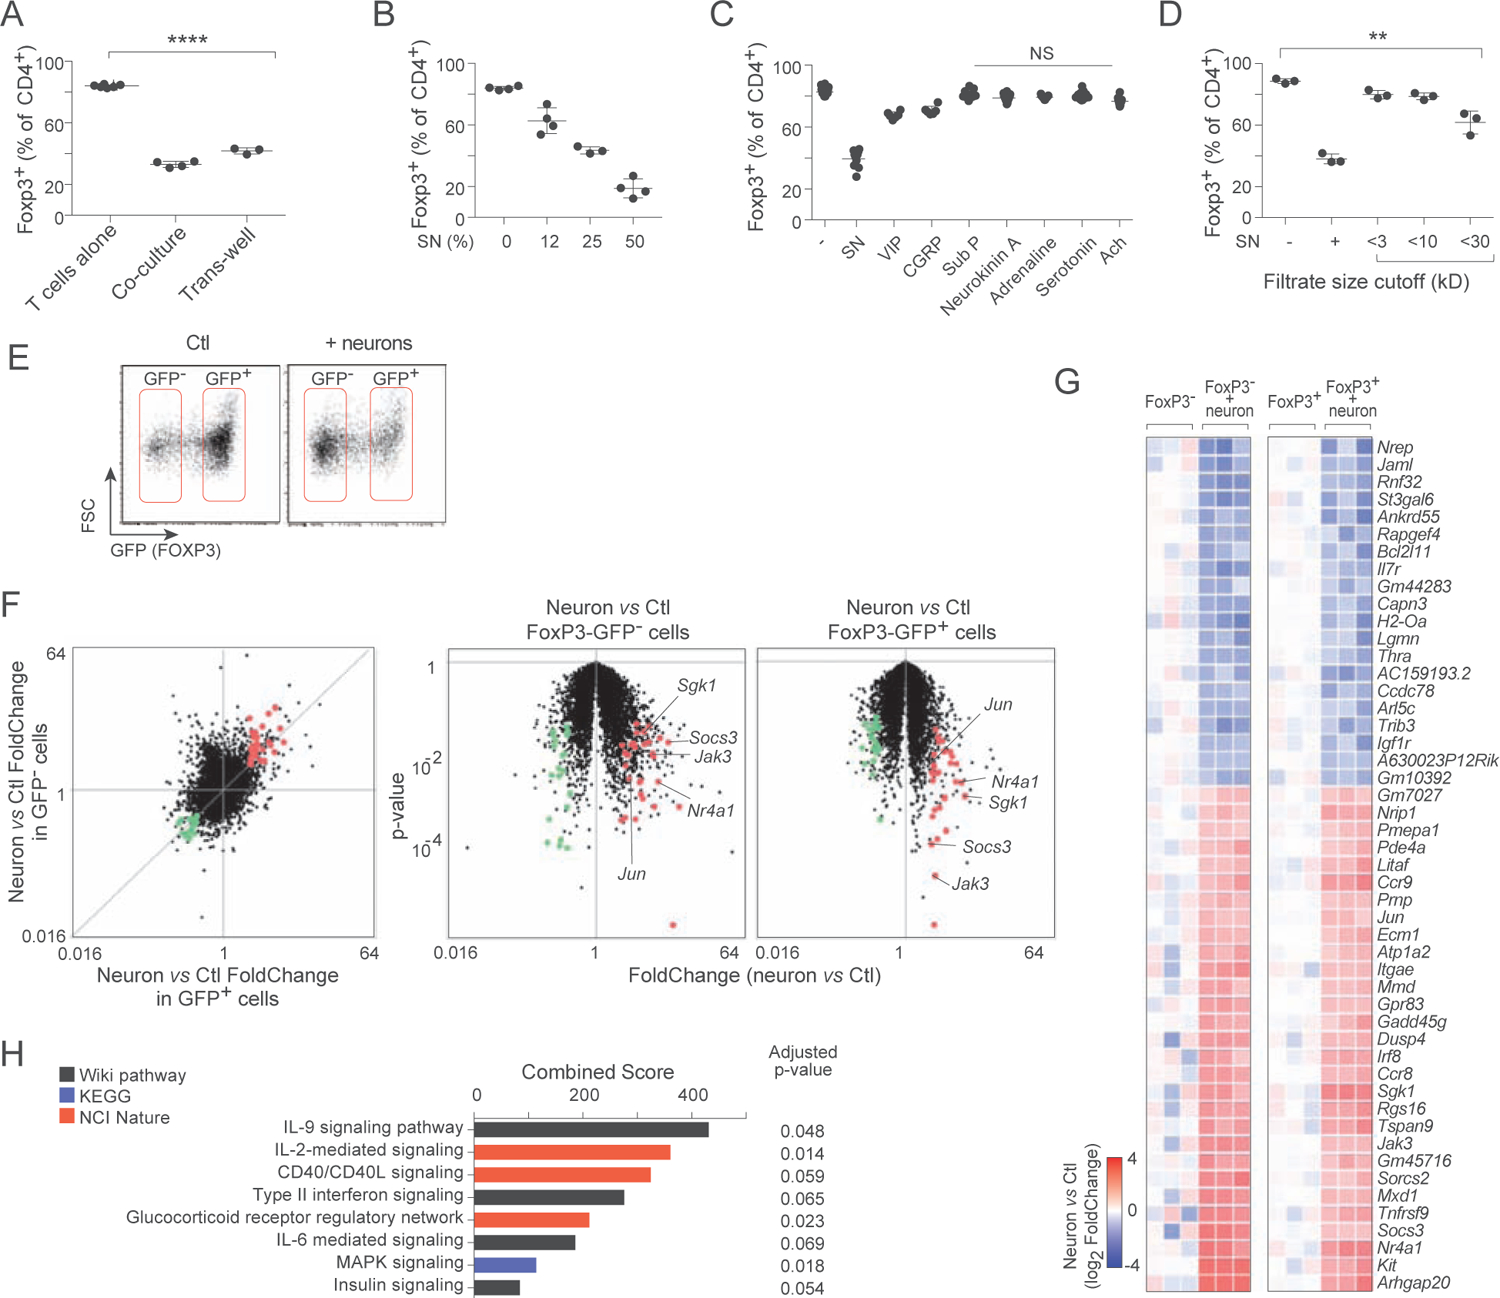
Figure 3. Enteric neurons inhibit iTregs through cytokine-like large soluble factors.

A. Frequency of Foxp3+ cells in 72 hr iTreg induction cultures, supplemented with neurons in direct contact or separated in a Transwell chamber. Each dot is an independent culture, composite of 3 experiments.
B. As in A, cultures supplemented with increasing dose of supernatant from 5 day cultures of primary MMP neurons. Composite of 2 experiments.
C. As in B, cultures supplemented with varying doses of neuromediators. Composite of 4 experiments. See Fig. S3 for detailed titration curves.
D. As in B, cultures supplemented with fractions from molecular weight cutoff filtration. Composite of 3 experiments.
E. Representative flow cytometry sorting gates for 72 hr iTreg cultures, alone or supplemented with neurons.
F. RNAseq profiling of cells shown in E. Left: changes in gene expression induced by the presence of neurons, shown on a “FoldChange/FoldChange” plot, relating in GFP+ iTregs and in non-converted GFP− cells. Right: FoldChange vs p.value “Volcano plot” showing the significance of neuron-induced changes in Foxp3-GFP− and Foxp3-GFP+ cells. Transcripts up- or down-regulated in T cells by MMP neurons in both cell states (at FC>2 and p.value<0.01) are highlighted (red and green).
G. Heatmap of changes in the geneset selected in F (log2 of FoldChange relative to the mean of controls, calculated independently for Foxp3−GFP+ and Foxp3−GFP− cells; each column is a biological replicate.
H. Pathway and GeneOntology analysis of the up-regulated transcripts in the signature from F.
