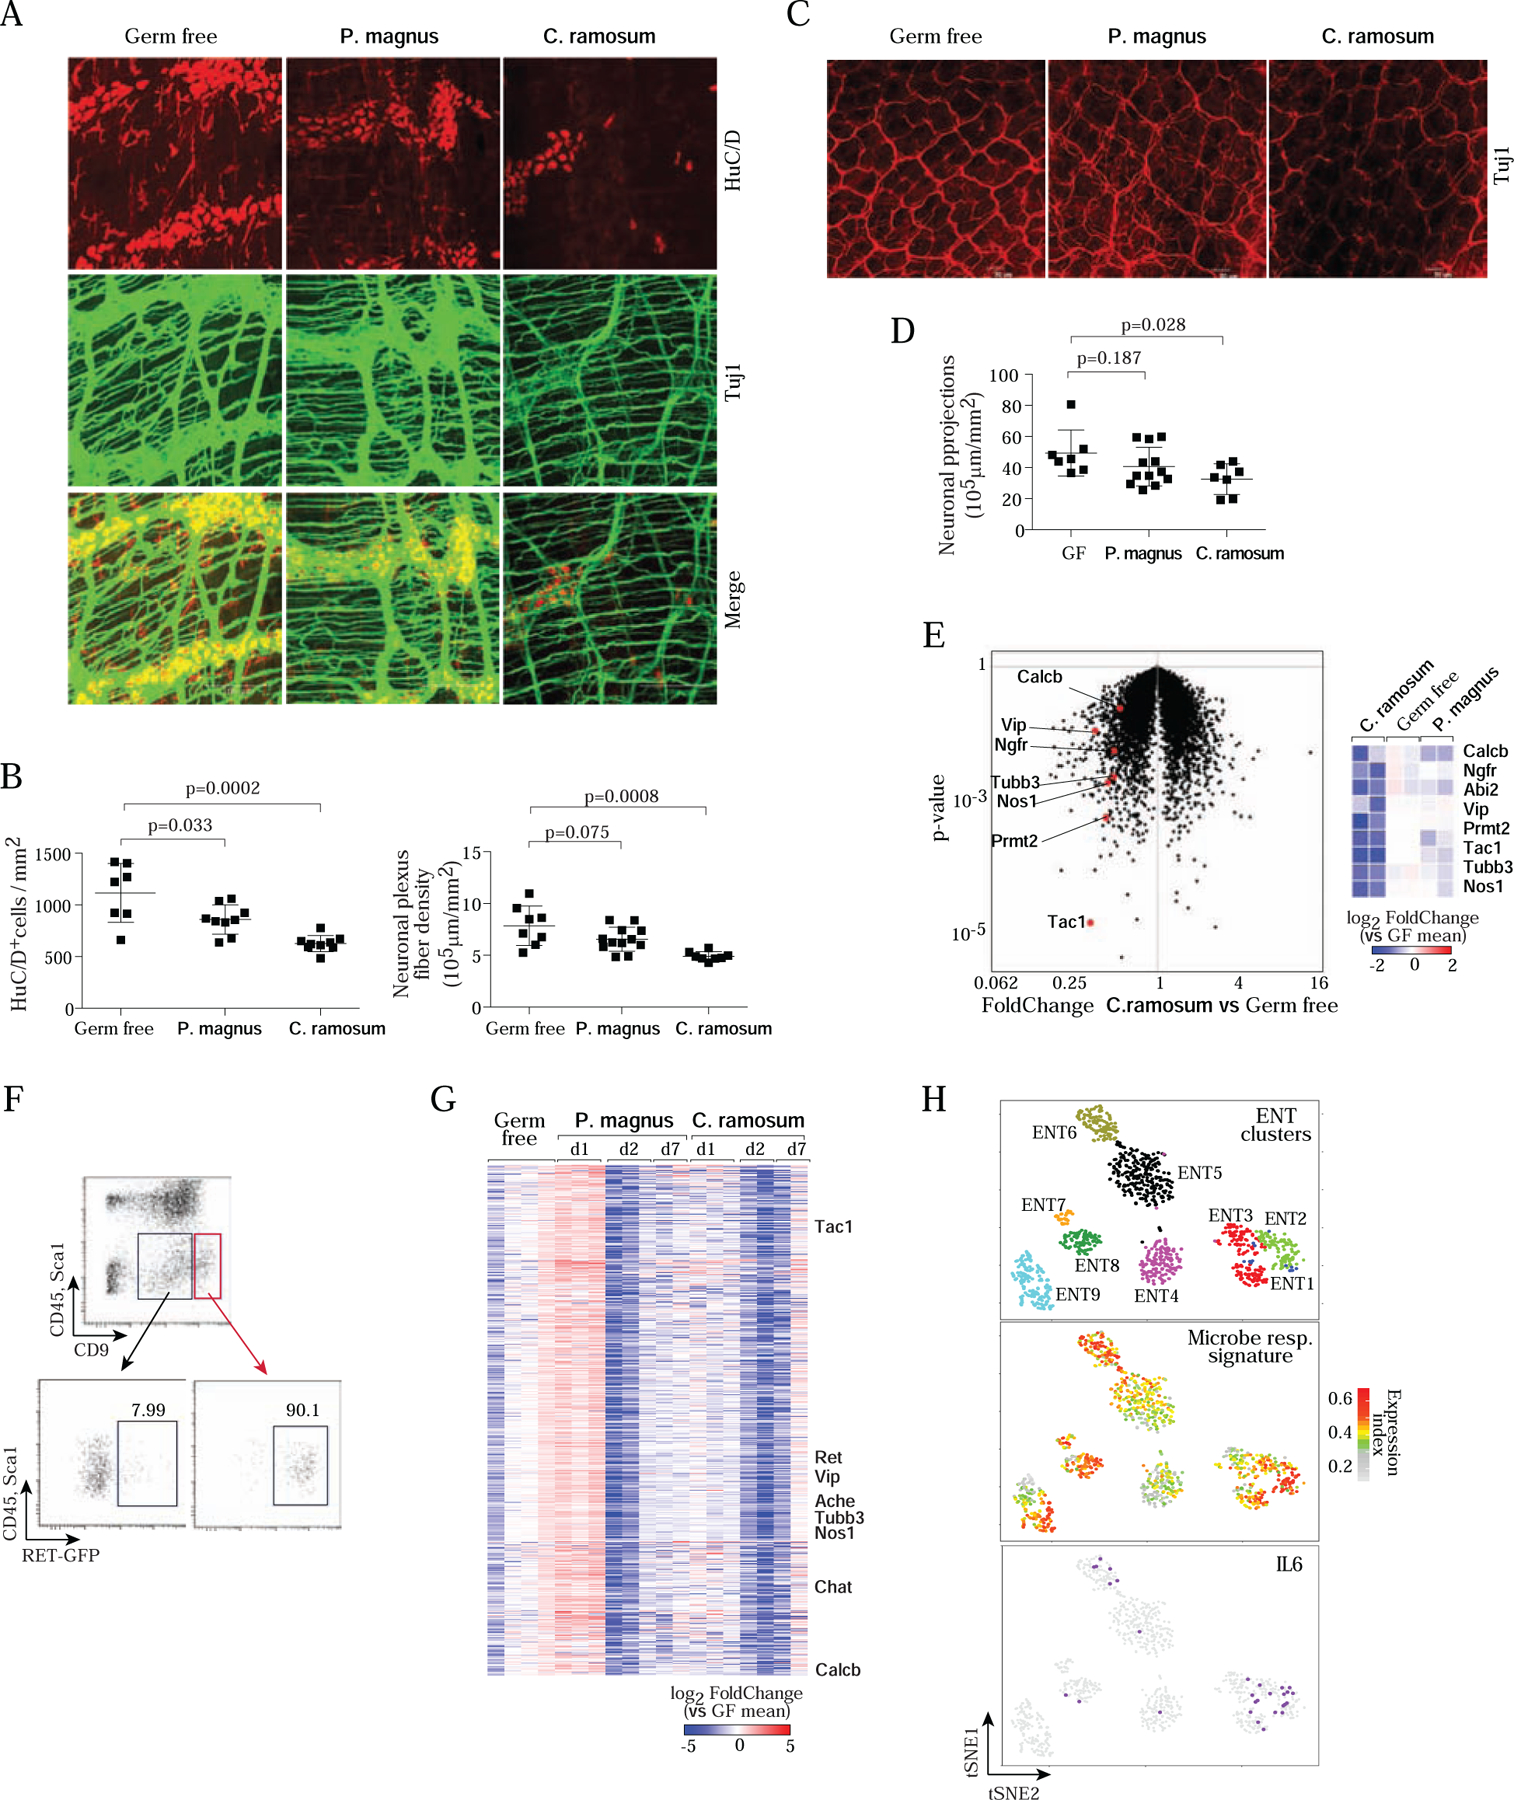
Figure 6. Commensal microbes affect neurons and their phenotypes.

A. Whole-mount staining and quantification of the myenteric plexus in colon segments in GF, C. ramosum- or P. magnus-monocolonized mice, immunostained for Tuj1 (neuronal bodies and fibers, green) and HuC/D (neuron cell bodies, red). Images are max projections of 50–100 stacks (each 0.5 μm apart). Images representative of 4 independent experiments, and 5 or more monocolonized mice.
B. Quantitation (Imaris software) of neuronal body (left) and fiber (right) densities in myenteric plexus from images as in A. Each dot represents a mouse, composite from 4 imaging experiments.
C. Whole-mount immunostaining as in A, but focused on projections in the lamina propria.
D. Quantitation of fiber density in images as in C.
E. GF mice were mono-colonized with C. ramosum or P. magnus for 1 day, and RNA was prepared from whole MMP (neuronal and muscle layers) for RNAseq profiling. Left: changes in gene expression induced by C. ramosum vs GF controls, with characteristic neuronal transcripts highlighted. Right: heatmap representation of changes (log2) vs mean of GF controls, in all replicates.
F. Gating strategy to sort MMP neurons (CD45−Sca1−CD9hi) from C.ramosum or P.magnus mono-colonized GF mice for RNAseq. Bottom panels displayed RET-GFP expression in MMP from Ret GFP/+ mice used to establish the strategy then applied to wild-type GF mice.
G. Changes in gene expression in sorted neurons (gated as in F) for transcripts of the major co- regulated cluster, at different times after mono-colonization with P.magnus and C. Ramosum. (log2 of FoldChange relative to the mean of GF; clustered by gene-gene correlation within the cluster; each column represents a different mouse). Hallmark neuronal genes indicated.
H. Differential expression across enteric neurons of the cluster of genes affected by bacterial colonization. Upper panel: single-cell RNAseq of small intestinal ENS from (Zeisel et al., 2018), neurons clustered and positioned using tSNE coordinates from that study. Middle panel: normalized expression index for the microbe-responsive cluster (genes from G, expression of each gene normalized to its mean expression across all cells, then all genes summed for each cell) on those cells. Lower panel: superimposition of Il6- positive cells on the same tSNE.
