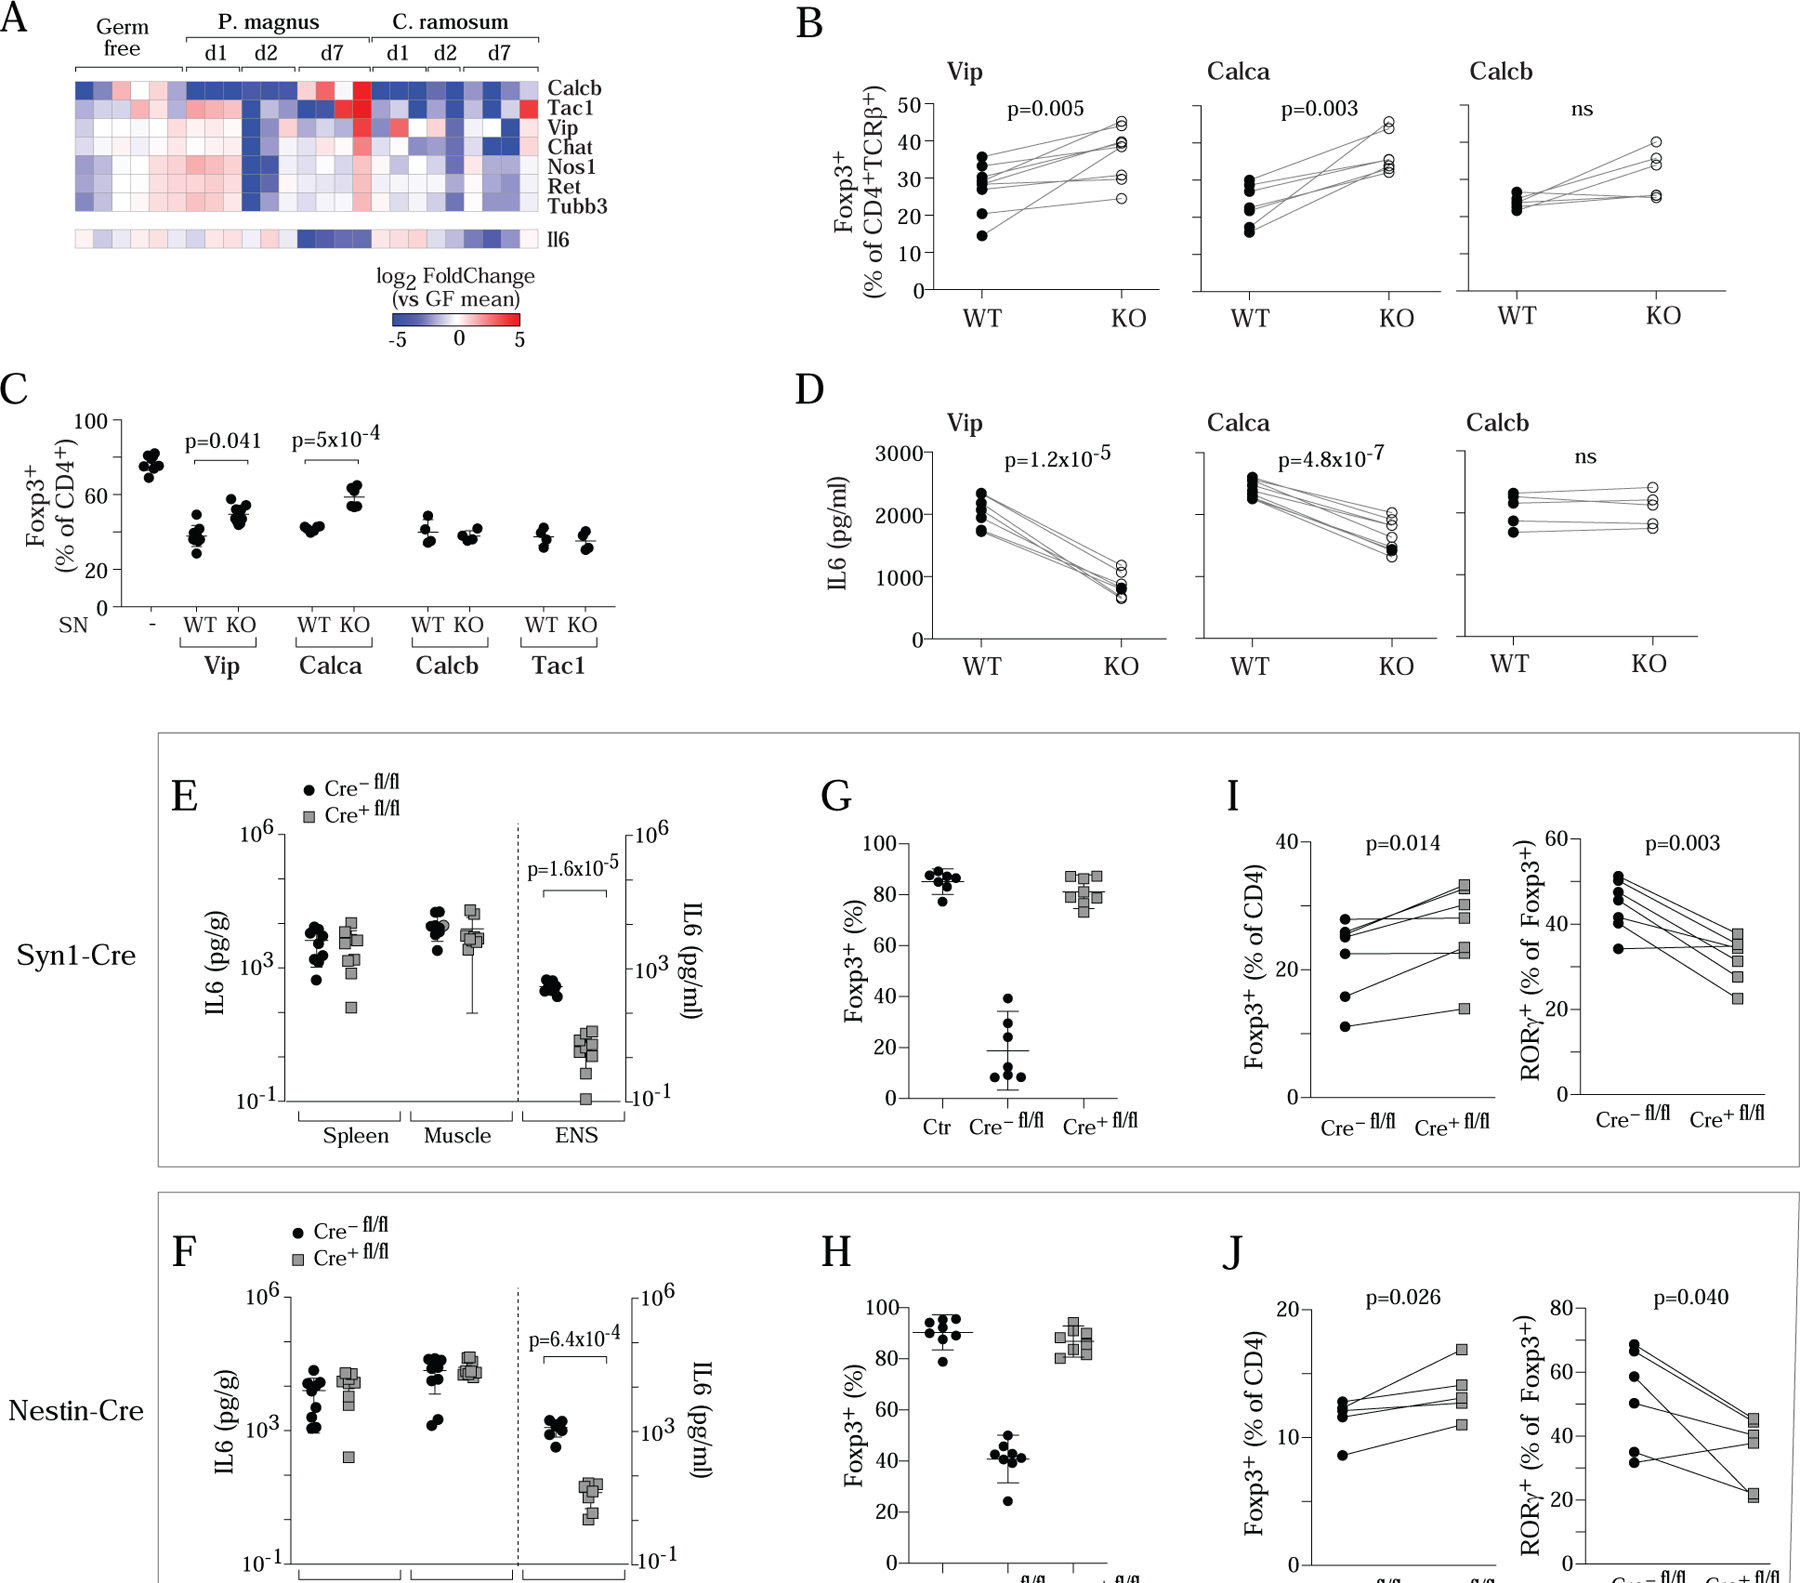
Figure 7. Genetic or microbial changes in neuronal IL6 affect Treg differentiation in vivo.

A. Expression of Il6 in sorted neurons during the monocolonization time-course experiment of Fig. 6G. Neurotransmitter transcripts repeated for reference.
B. Frequency of colonic Treg cells within CD4+ T cells in Vip−/−, Calca−/−, Calcb−/− mice or control littermates.
C. iTreg induction cultures were supplemented with neuronal SN (25%) produced by cultured MMP from Vip−/−, Calca−/−, Calcb−/− or Tac1−/− mice or their wild-type littermates. Each dot is an independent culture, composite of 3 experiments.
D. IL6 levels (ELISA) in neuronal SN from Vip−/−, Calca−/−, or Calcb−/−or their wild type littermates.
E,F. IL6 levels in MMP neuronal SN from Syn1-CreIl6fl/fl (E) and Nestin-CreIl6fl/fl (F) or their control littermates (mostly cre-negative). LPS-stimulated (100ng/ml, overnight) whole spleen or muscle cultures used as a control.
G,H. MMP neurons from Syn1-CreIl6fl/fl (G) and Nestin-CreIl6fl/fl (H) or their wild type littermates were adapted to culture, then co-cultured along with CD4+ T cells in 72 hr iTreg induction cultures, and the effect on induction of FoxP3 assessed by flow cytometry. Each dot is an independent culture, composite of 3 or more experiments.
I,J. Frequency of colonic Treg cells and RORγ+Treg cells within CD4+ T cells in Syn1-CreIl6fl/fl (I) and Nestin-CreIl6fl/fl (J) or wild-type control littermates. Throughout, each dot represents an individual mouse unless mentioned, p-value from paired Student’s t test.
