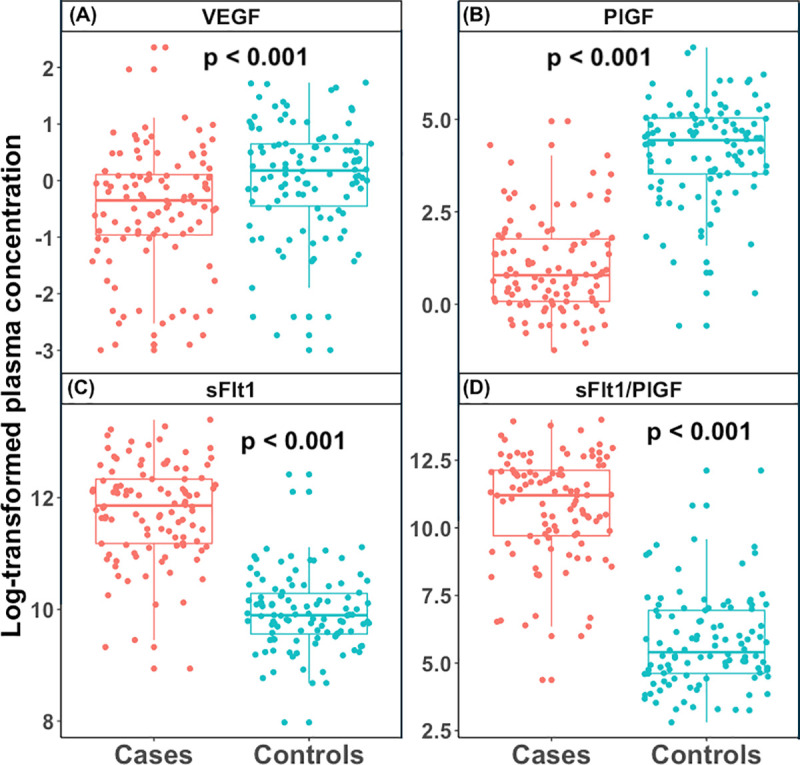
Fig 2. Plasma levels of angiogenic factors.

(A) Logarithm of the median plasma levels of vascular endothelial growth factor (VEGF) in cases Vs controls, (B) logarithm of the median plasma levels of placental growth factor (PlGF) in cases Vs controls, (C) logarithm of the median plasma levels of soluble fms-like tyrosine kinase-1 (sFlt-1) in cases Vs controls, (D) logarithm of the median plasma levels of and sFlt-1/PlGF ratio in cases Vs controls. The Boxes represent interquartile range, with the top and bottom horizontal lines indicating the 75th and 25th percentiles of the data for each group (cases and controls). The horizontal line within the box represents the median value. Significant differences between cases and controls was observed for each angiogenic factor (p-value <0.001).
