
Fig 3. Distribution of angiogenic factors across GA categories.
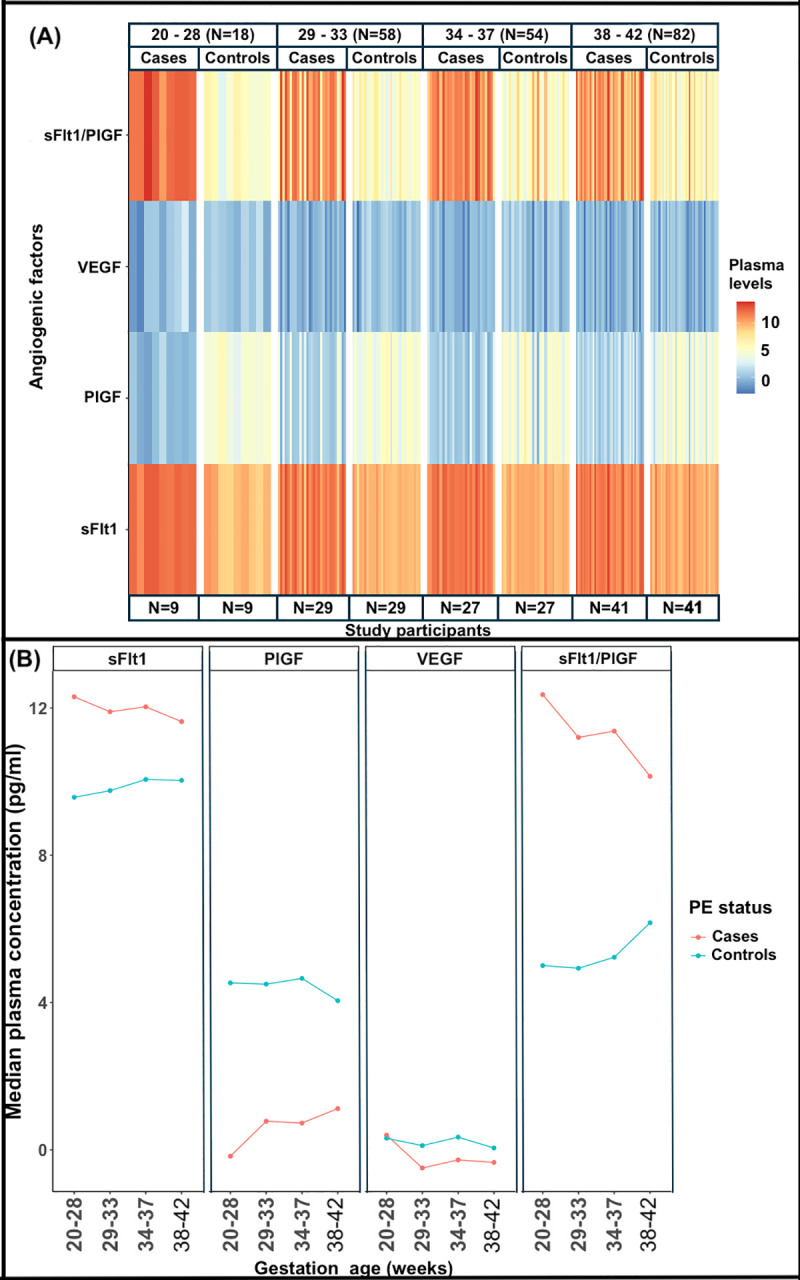
(A) Heat map showing the distribution of logarithm plasma levels of angiogenic factors between cases and controls groups across the GA categories, (B) trend curves of log transformed plasma concentrations of each angiogenic factor across GA categories, between cases and controls. sFlt1, PlGF and sFlt1/PlGF ratio were significantly different at all GA categories.