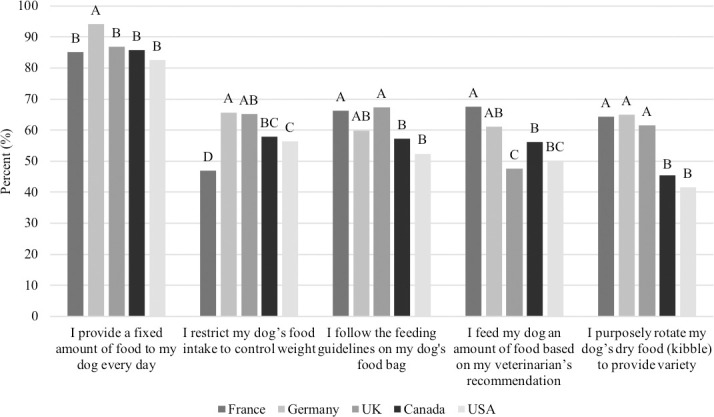
Fig 4. Percent of respondents that answered ‘true’ to the five feeding statements, among countries (n = 3,298).

Proportions in the same category that do not share a common letter are significantly different at P<0.05.

Proportions in the same category that do not share a common letter are significantly different at P<0.05.