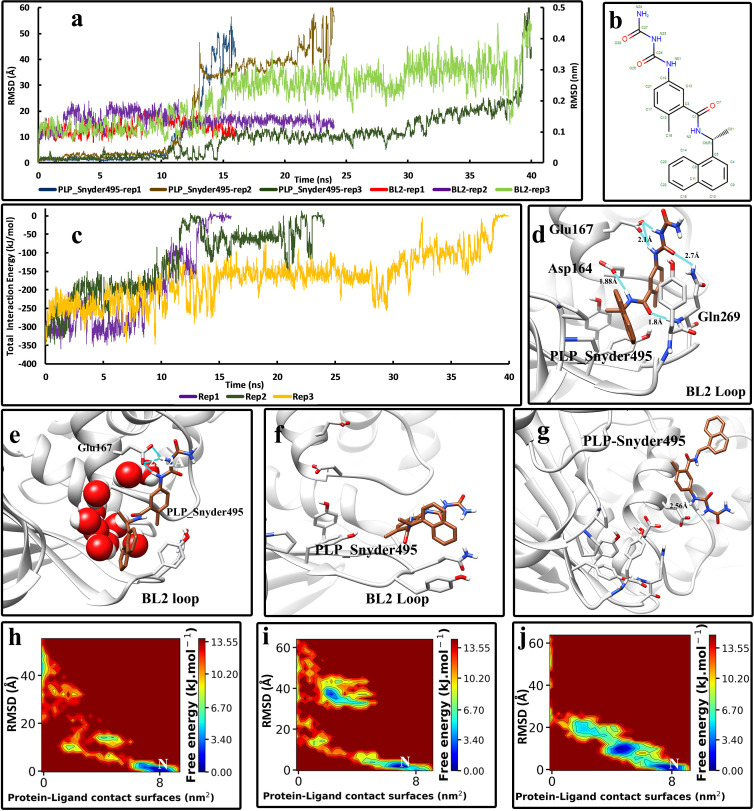
Fig 4. The details of the unbinding pathway of PLP_Snyder495 from SARS-CoV-2 Plpro in three series of replicas.
(A) The RMSD values of the inhibitor in three replicas (Displayed in Å) and the backbone RMSD values of residues of the BL2 loop in three replicas (Displayed in nm) throughout the simulations. (B) The 2D structure of PLP_Snyder495 was obtained from PDB. (C) The Total interaction Energies of the protein-ligand complexes throughout the simulations. (D) The bound state of the PLP_Snyder495 in the crystallographic (native) conformation and the interactions with the residues of the binding pocket (frame at 0 ns). (E) An intermediate state of PLP_Snyder495 in the unbinding pathway where the inhibitor gradually lifted up and out of the binding pocket and made stronger hydrogen bonds with the Glu167 (1st replica, frame in 12 ns). (F) Another intermediate state where the BL2 loop is entirely flat and the inhibitor is stuck to the residues on the tip of the loop (Tyr268 and the Gln269) (3rd replica, frame in 25 ns). (G) The unbound state of the inhibitor is entirely free and solvated in the simulation box. (H) The free energy landscape (FEL) representation of the unbinding pathway of the PLP_Snyder495, replica No 1. (I) The free energy landscape (FEL) representation of the unbinding pathway of the PLP_Snyder495, replica No 2. (J) The free energy landscape (FEL) representation of the unbinding pathway of the PLP_Snyder495, replica No 3. Letter “N” indicates the native crystallographic conformation.

