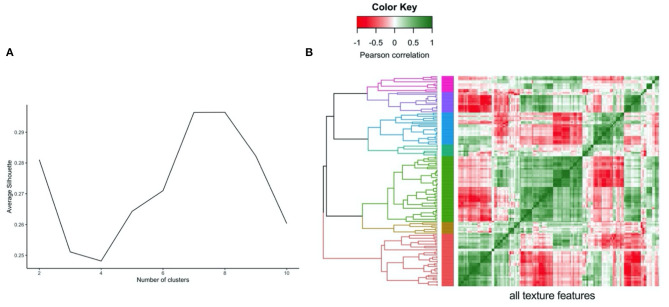
Figure 1.
Illustration of clustering method (hierarchical) and approach to defining the number of clusters (average silhouette approach) for the LV myocardium radiomics texture features. (A) Average silhouette statistic for complete-linkage hierarchical clustering of texture feature correlations. The silhouette statistic reflects the average distance between data points in the same cluster compared against average data points in other clusters and allows judgement of the optimal number of clusters within a sample, such that distance between datapoints within clusters are minimised whilst maximising distance with datapoints from other clusters. We computed average silhouette statistic for 2 to 10 clusters. Maximum silhouette statistic was observed with 7 and 8 clusters. Hence, we take 7 clusters as representing the optimal number of clusters within our samples. (B) Correlation heatmap, rows and columns correspond to all texture features creating grid with all possible pairs of texture features, grid colour corresponds to Pearson Correlation between pair of features at that point. Grid rows re-ordered by hierarchical clustering of correlations with tree coloured for optimal seven cluster cut of the tree.

