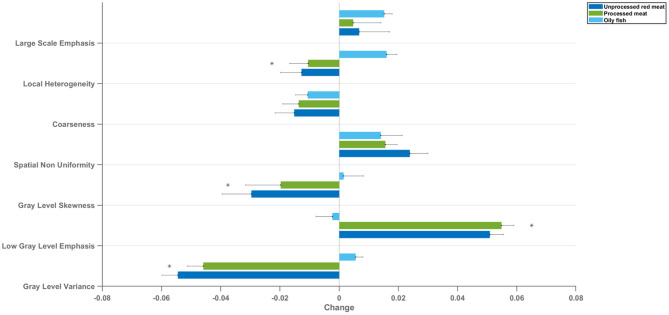
Figure 5.
Mean change in LV myocardium CMR radiomics texture feature clusters per 100 g increase in daily meat consumption. Each bar represents mean standardised beta coefficients corresponding to the indicated texture feature cluster. Models are adjusted for age, sex, social deprivation, educational level, smoking, alcohol intake, and exercise level (confounder adjusted model). Black lines represent half-length of confidence interval for the corresponding bar. CMR: cardiovascular magnetic resonance; LV: left ventricle *denotes p < 0.05 in using Kruskal–Wallis statistical testing followed by Dunn's correction test for multiple comparisons between oily fish and unprocessed red meat and between oily fish and processed red meat.

