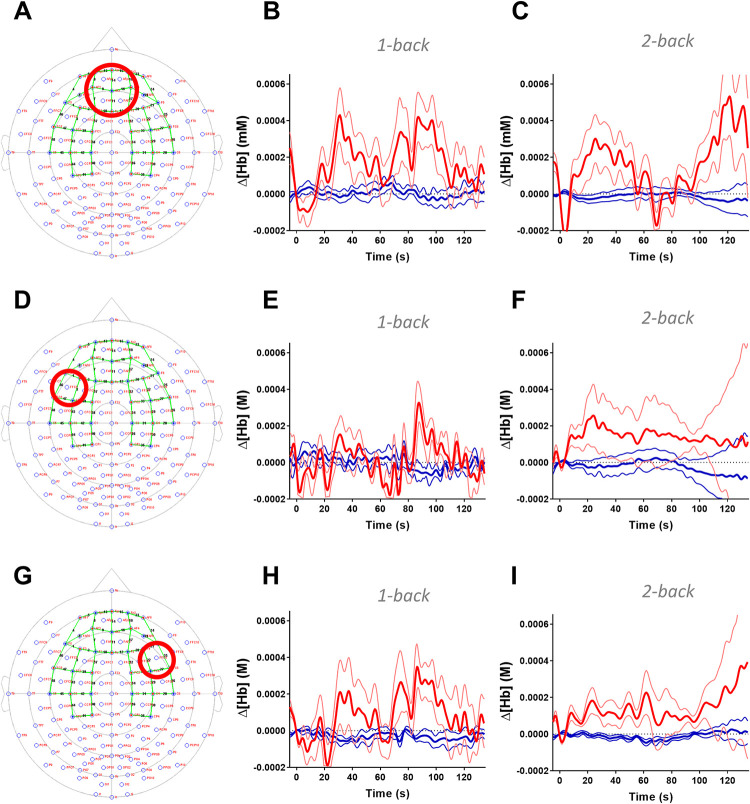
Fig 4. Block average traces over the prefrontal cortex and dorsolateral prefrontal cortex during the cognitive n-back stimulation using functional near-infrared spectroscopy.
Group average traces of oxy-hemoglobin (HbO, red lines) deoxy-hemoglobin (HbR, blue lines) concentrations were plotted from medial prefrontal cortex (PFC; Panel A), left and right dorsolateral prefrontal cortex (DLPFC; Panel D and G). Region of interests are shown on Panel A, D, and G within the international 10–20 space, and green lines represent channels. 2-back cognitive tasks elicited visible changes in HbO and HbR levels with profound hemodynamic responses during 2-back condition in the medial PFC and left DLPFC (Panel C and F). DLPFC ROI based on Vassena et al. [10]. Mean±SD is plotted for each channel. Data for individual channels are shown in S2 and S3 Figs.

