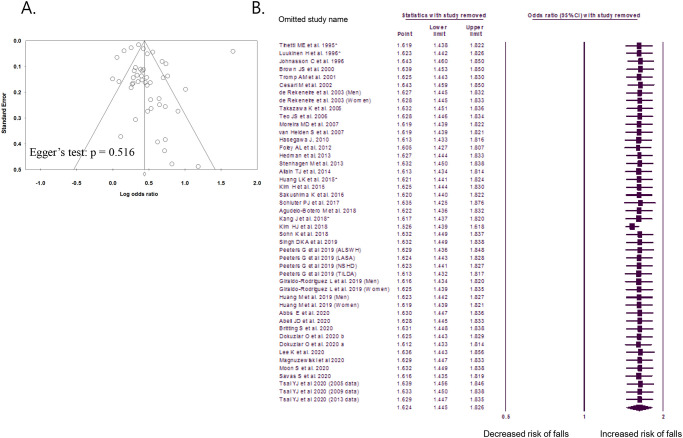
Fig 4. Funnel plot and sensitivity analysis.
A. Funnel plot of publication bias in studies comparing the odds ratios of urinary incontinence for falls. B. Sensitivity analysis of the meta-analysis of studies comparing the odds ratios of urinary incontinence for falls. *Study that defined falls as at least two falls within 1 year.

