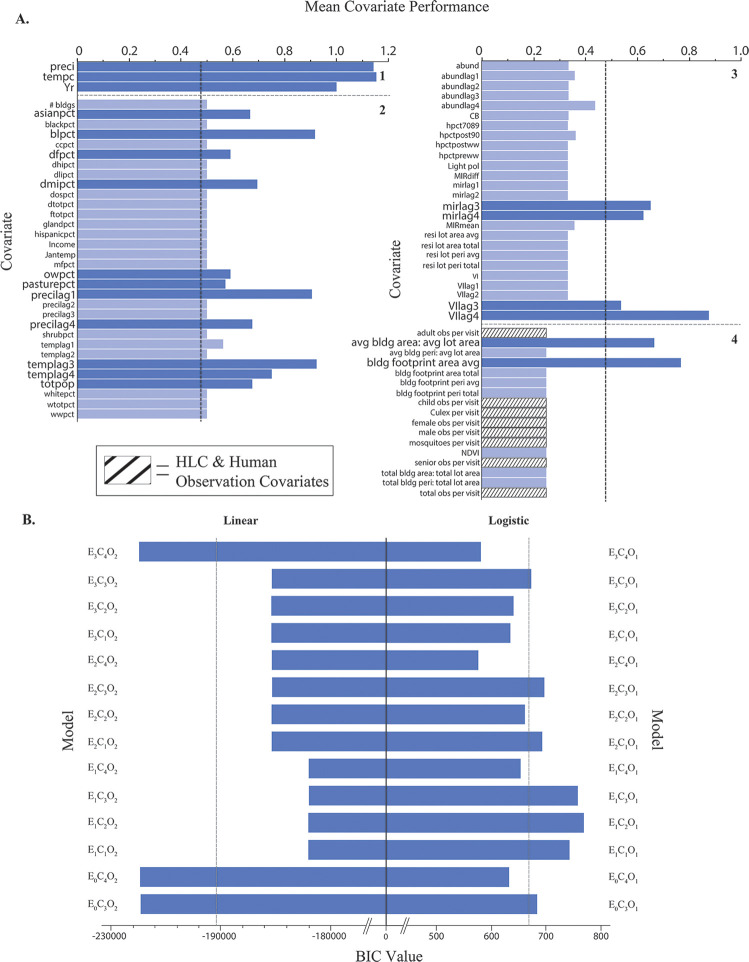
Fig 4. Overall performance for each predictor and final model used in this study.
Each of the 70 covariates used in the study, listed in alphabetic order by data availability/work load to acquire score (1–4), were evaluated by mean performance (A). Highest performing covariates are noted by enlarged label text and darker blue bar color. The overall performance for each linear and logistic model (n = 14 for both) was evaluated by BIC value (B). Means for each outcome (covariate = 0.48; linear = -193406; logistic = 670.9) are designated by vertical dashed lines. Details of scoring for each covariate and model are provided in S3 Table.

