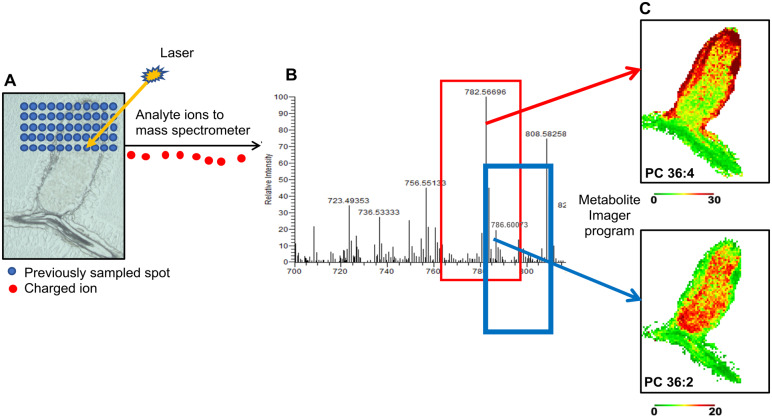
Figure 2.
Schematic showing the MALDI–MSI method. A, A laser is rastered over a DHB-coated nodule cross-section in a series of spot points with a given x–y coordinate. The example shown is a nodule cross-section of M. truncatula R108 (25 µm). B, The analyte ions produced are directed to a mass spectrometer, where their m/z values are measured. C, Metabolites are identified, and images are generated using Metabolite Imager. For example, PC 36:4 and PC 36:2 as shown.

