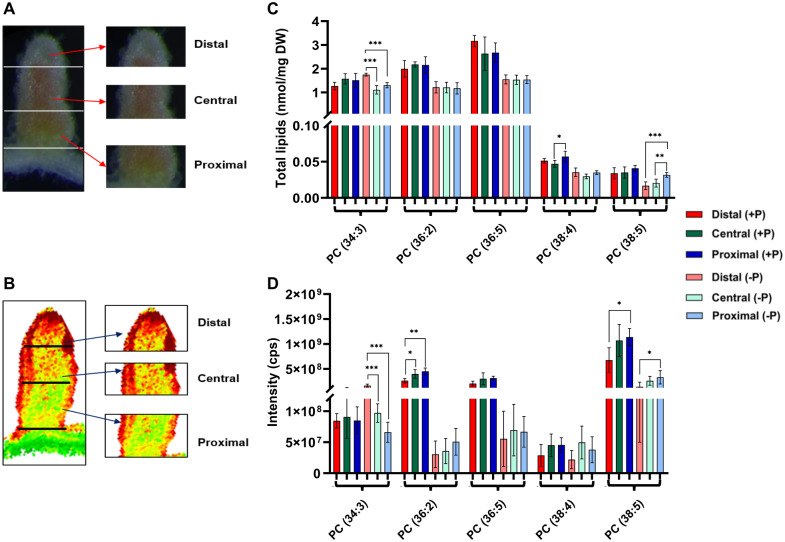
Figure 4.
Comparison of ESI–MS and MALDI–MSI results for PC species in different sections of dissected nodules. A, Bright-field image of a nodule dissected into distal, central, and proximal sections used for ESI–MS analysis. B, Virtually dissected nodule into distal, central, and proximal sections used for MALDI–MSI analysis. C, Quantitative data of representative PC species obtained from distal, central, and proximal nodules sections using ESI–MS. Values are expressed as total lipids (nmol/mg DW of tissue) after normalizing with the amount of respective standards. D, Representative PC species obtained from distal, central, and proximal nodules sections using MALDI–MSI are expressed in intensities count per second; values are mean ± sd (N = 5). Error bars indicate sd. Asterisks indicate a significant difference between the control plants (+P) and test plants (−P), as determined using one-way ANOVA analysis; *P ≤ 0.05; **P ≤ 0.01; ***P ≤ 0.001.

