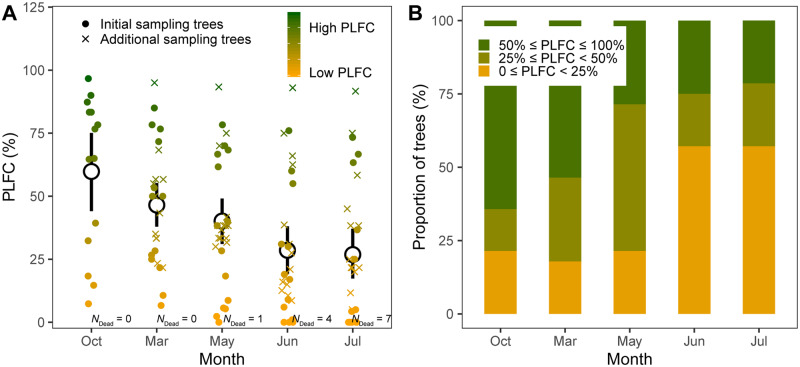
Figure 2.
The dynamics of tree death over time. A, The dynamics of tree PLFC during sampling periods. Data points are staggered to reveal overlapping points. Different colors of points refer to the gradient of PLFC. Central circles and bars indicate mean values with 95% confidence interval. Solid circles refer to PLFC of the initial 14 target trees; crosses refer to PLFC of the 14 more target trees added to increase sampling sizes from March 2019. Numbers near points refer to the amounts of dead trees (i.e. PLFC = 0%) within the 14 or 28 sampling sizes. Lmer analysis showed that PLFC changed significantly with time (F-value = 31.64, P < 0.001; Supplemental Table S1). B, The proportion of trees with 50% ≤PLFC ≤ 100%, 25% ≤ PLFC < 50%, and PLFC < 25% over sampling periods.

