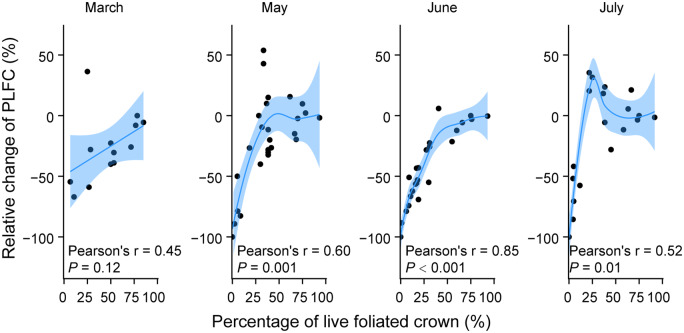
Figure 3.
Relationships between the PLFC at each sampling time and relative change of PLFC compared to last sampling time. Either a linear or loess function (blue line) was chosen to better represent the relationships. Shaded areas represent 95% confidence intervals for predictions. Note that the occasional appearance of positive values of relative change of PLFC is due to the error in the estimation of PLFC. The comparisons of PLFC among sampling time for each tree are shown in Supplemental Table S2.

