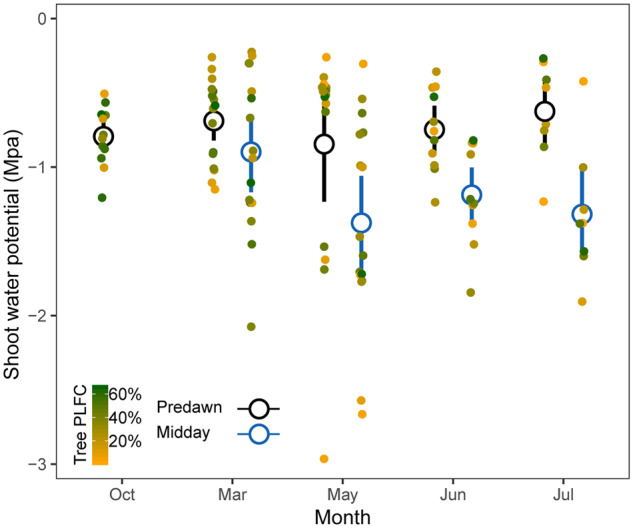
Figure 5.

Shoot water potential dynamics over time. Data points are staggered to reveal overlapping points. Different colors of points refer to the PLFC. Black and blue central circles with bars indicate mean predawn and mid-day water potential with 95% confidence interval, respectively. Lmer analysis showed that predawn and mid-day water potential did not change with time (F-value = 0.30, P = 0.88 for predawn water potential; F-value = 0.24, P = 0.87 for mid-day water potential; Supplemental Table S3).
