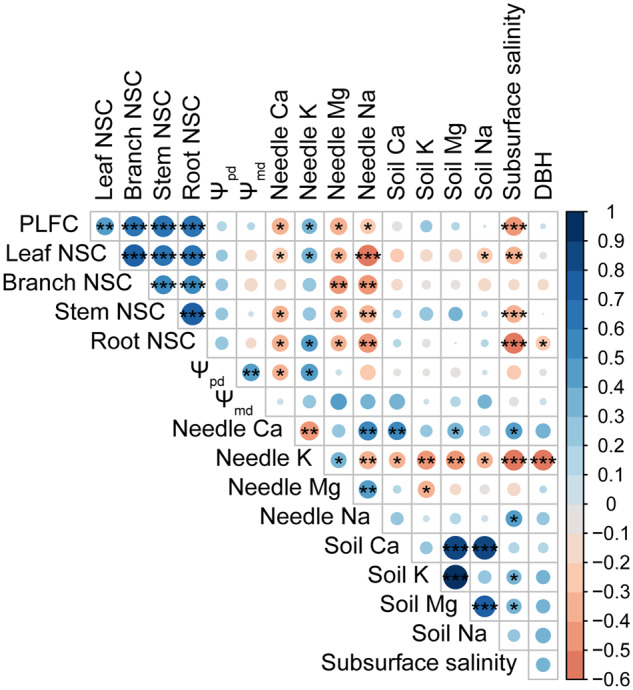
Figure 6.

Correlation matrix for PLFC, tissue NSC concentrations, shoot predawn and mid-day water potentials (Ψpd and Ψmd), ions (Na+, K+, Ca2+, Mg2+) contents in needles and soil, modeled subsurface salinities, and stem diameters at breast height (DBH). The color of each circle represents the correlation coefficient (scale to right of matrix). The size of the circle and asterisks represent the significance level (*P < 0.05; **P < 0.01; ***P < 0.001).
