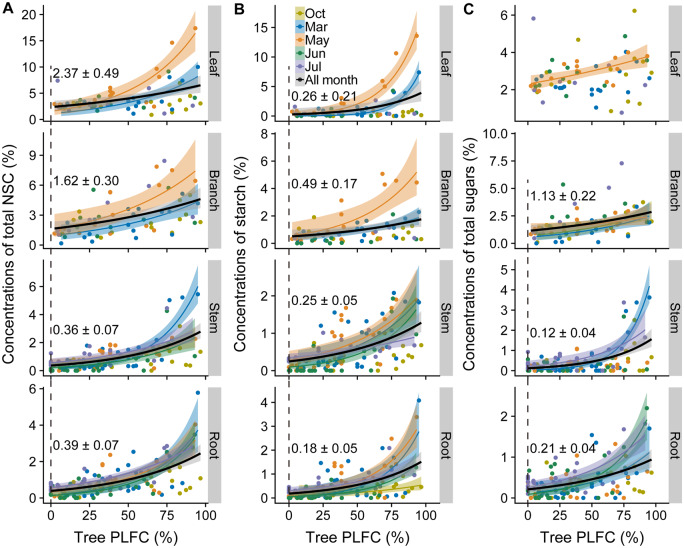
Figure 7.
Relationships of crown mortality and carbohydrates. Relationships between PLFC and total NSC (A), starch (B), and soluble sugars (C) concentrations in leaves, branches, stems, and roots. Colors within each panel represent the sampling months: October (tawny), March (blue), May (orange), June (green), and July (purple), all months combined (black). The fitted model is GLMs with log links. Shaded areas represent 95% confidence intervals of the regression lines. Only significant regressions are shown (P <0.05, details of model predictions are in Table 1 and Supplemental Table S5). Values shown in each panel are the concentrations of NSC (or its components, ± se) predicted at 0% PLFC from significant regressions overall the sampling periods.

