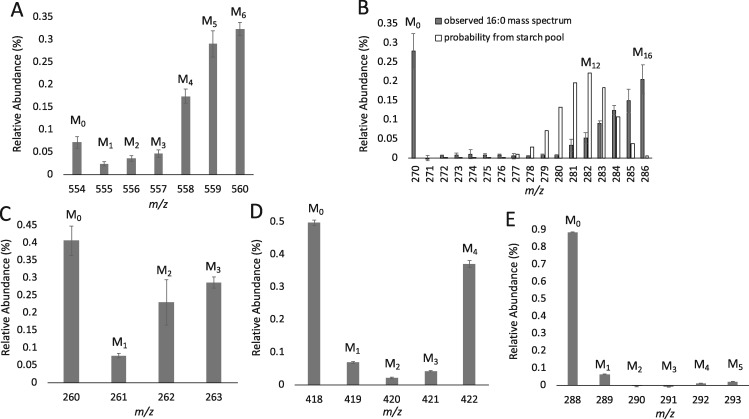
Figure 10.
13C isotopomer distribution of glucose units from hydrolyzed starch and amino acids from hydrolyzed protein at the end of the N-deprivation labeling period in timecourse B. Mass isomer distributions are shown for glucose from hydrolyzed starch (A) and a 16:0 FA from DGDG at 24 h of N-resupply with a binomial distribution overlaid showing the probability of deriving an 16-carbon FA with varying degrees of labeling from the starch pool (B). Mass isomer distributions are shown for amino acids alanine (C), aspartate (D), and valine (E). Error bars indicate ±SD (n = 3) for glucose (A) and FA (B), and error bars indicate range (n = 2) for amino acids (C–E).

