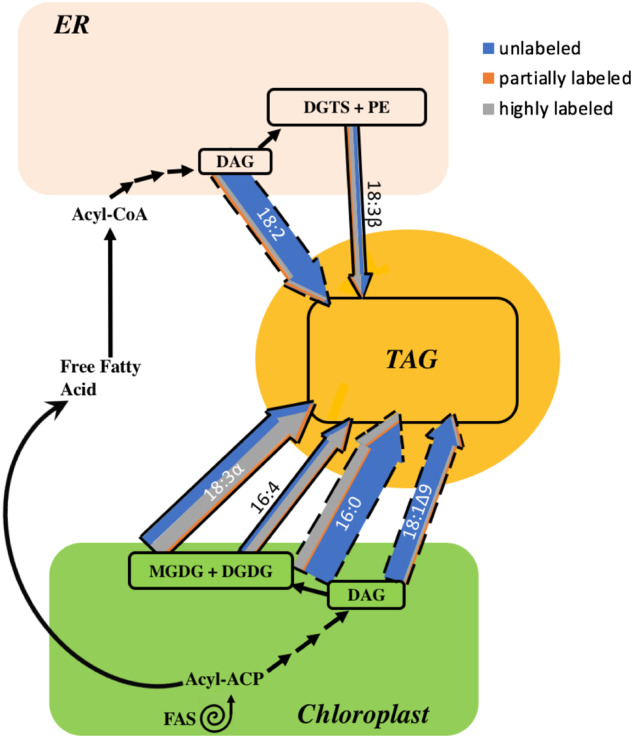
Figure 12.

Acyl chain flux into TAG during N-deprivation in timecourse A. Membrane lipid and de novo FA synthesis contribution to TAG accumulation during N-deprivation. Colored arrows represent acyl chain fluxes into TAG at 36 h of N-deprivation after labeled acetate was applied during N-replete growth (Figure 1A). Arrow weights are based on the quantity of each FA and divided into low, intermediate, and high levels of labeling based on the isotopic label distribution of each FA in TAG. FAs whose origins are more certain are shown with a bold border, while those whose origins are less clear are shown with a dashed border. Black arrows indicate routes of fatty acyl chain movement without indicating relative quantities, sequential black arrows indicate multi-step pathways.
