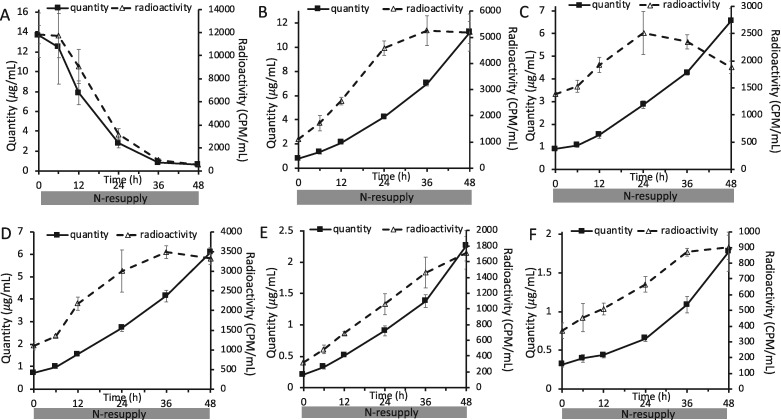
Figure 6.
Quantity and level of radioactivity of different lipid classes during N-resupply in timecourse B. Quantity and radioactivity of TAG (A), MGDG (B), DGDG (C), DGTS (D), PE (E), and SQDG (F) during the experiment in which labeled acetate was applied during N-deprivation followed by an unlabeled N-resupply period (Figure 1B). Lipid extracts were separated on TLC plates, individual bands were scraped off, converted to FAMEs, and quantified via GC-FID. Radioactivity in resulting FAMEs was measured via liquid scintillation counting. Error bars indicate ±SD (n = 3).

